| | | | |
Report on last months NewsGTA Resale Housing Sales Up |
|
|
Report as of Sunday, December 31, 2023In this Issue of my newsletter |
 This is the report for latest month in real estate sales from the Toronto Regional Real Estate Board and indicates a 'normal' amount of activity and price levels.
Below is the latest release of figures
Highlights of the latest report from TRREB for the Residential Real Estate Market in the GTA Real Estate Prices UP and Sales Volume UP - Mississauga and GTA Real Estate Newsletter October 2023 - Issue 10:08 This months Real Estate Update brings more market news from our real estate market here in Mississauga, Toronto and the GTA. Enjoy and I wish you all the best! Mark
See more at this page about average prices and read the TRREB full price and data report below. |
|||
PRESS RELEASE: Sales & Price Growth Continue last monthSee the full press release above.
Please refer to this page to see a graph of Average prices and More |
|||
This is the full price and data report from TRREB for last monthGTA REALTORS® RELEASE MONTHLY RESALE HOUSING MARKET FIGURES TRREB RELEASES RESALE MARKET FIGURES AS REPORTED BY GTA REALTORS® GTA REALTORS Release August Stats Higher borrowing costs, continued uncertainty about the economy and Bank of Canada decision making, and the constrained supply of listings resulted in fewer home sales in August 2023 compared to August 2022. The average selling price remained virtually unchanged over the same period. On a seasonally adjusted monthly basis, sales and average price edged lower. Looking forward, we know there will be solid demand for housing both ownership and rental in the Greater Toronto Area and broader Greater Golden Horseshoe. Record immigration levels alone will assure this. In the short term, we will likely continue to see some volatility in terms of sales and home prices, as buyers and sellers wait for more certainty on the direction of borrowing costs and the overall economy, said TRREB President Paul Baron. Greater Toronto Area REALTORS® reported 5,294 sales in August 2023 down by 5.2 per cent compared to August 2022. New listings were up by 16.2 per cent year-over-over, providing some relief on the supply front, but year-to-date listings are still down substantially compared to the same period last year. Seasonally adjusted sales were down slightly by one per cent month-over-month compared to July 2023, while new listings were up slightly by 1.3 per cent compared to July. More balanced market conditions this summer compared to the tighter spring market resulted in selling prices hovering at last years levels and dipping slightly compared to July. As interest rates continued to increase in May, after a pause in the winter and early spring, many buyers have had to adjust their offers in order to qualify for higher monthly payments. Not all sellers have chosen to take lower than expected selling prices, resulting in fewer sales, said TRREB Chief Market Analyst Jason Mercer. The MLS® Home Price Index Composite benchmark for August 2023 was up by 2.5 per cent year-over-year. The average selling price was also up, but by less than one per cent to $1,082,496 over the same timeframe. On a monthover- month seasonally adjusted basis, the MLS® HPI Composite benchmark was virtually unchanged and the average price edged lower by 1.6 per cent. While higher interest rates have certainly impacted affordability, the prospect of higher taxes will also hit households balance sheets, especially younger buyers with limited savings. With the City of Toronto moving to raise the municipal land transfer tax (MLTT) rate on properties over $3 million as a revenue tool, it must also consider helping first-time home buyers struggling to enter the market by adjusting their tax rebate threshold to reflect todays higher home prices, said TRREB CEO John DiMichele. Mark |
|||
See the seasonal trends in graphical form
I hope this finds you Happy and Healthy!
All the Best!
Mark
Read about Housing market indicators from last month
Below is a Graph showing TRREB Historical Average Price Data
|
|
|
See the Average Price Cycles from January 1995 to Date - a very interesting cyclical pattern is clearly seen!


See how the historical 1 year mortgage interest rate compares to the 5 year rate
This graph shows the 1989 real estate recession in the GTA and how long it took to recover from the drop in the average price from the peak price in February of 1989 to 2002

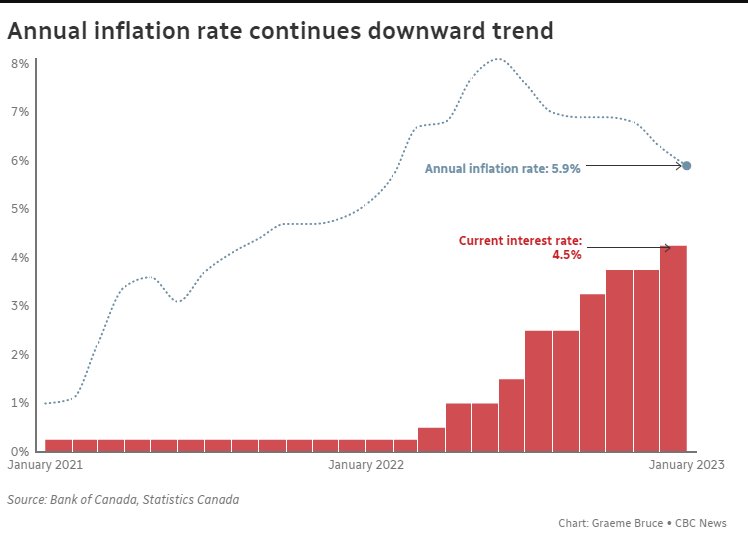
Statistics Canada, Quarter-over-quarter growth, on an annual basis, Statistics Canada, Year-over-year growth for the most recently reported month, Bank of Canada, Rate from most recent Bank of Canada announcement Bank of Canada, Rates for most recently completed month
Of Mississauga’s 240,660 households, 66,655 or 27.7 per cent were renters in 2016, earning an annual income of $58,272. The average cost of rent and utilities per month for Mississauga renters came in at $1,281 compared to $1,109 for the rest of Ontario.
Notes
1. Sales, dollar volume, average sale prices and median sale prices are based on firm transactions entered into the TRREB MLS® System between the first and last day of
the month/period being reported.
2. New listings entered into the TRREB MLS® System between the first and last day of the month/period being reported.
3. Active listings at the end of the last day of the month/period being reported.
4. Ratio of the average selling price to the average listing price for firm transactions entered into the TRREB MLS® System between the first and last day of the month/period
being reported.
5. Average Listing Days on Market (Avg. LDOM) refers to the average number of days sold listings were on the market. Average Property Days on Market (Avg. PDOM) refers
to the average number of days a property was on the market before selling, irrespective of whether the property was listed more than once by the same combination of
seller and brokerage during the original listing contract period.
6. Active Listings at the end of the last day of the month/period being reported.
7. Past monthly and year-to-date figures are revised on a monthly basis.
8. SNLR = Sales-to-New-Listings Ratio. Calculated using a 12 month moving average (sales/new listings).
9. Mos. Inv. = Months of Inventory. Calculated using a 12 month moving average (active listings/sales).
10. "Bradford West Gwillimbury" is referred to as "Bradford" and "Whitchurch-Stouffville" is referred to as "Stouffville" in the report
Historic Sales Figures
Rental Market indicators in the GTA
Mississauga MLS Real Estate Properties & MLS.CA Homes for Sale | All Pages including Mississauga Real Estate Blog all maintained by info@mississauga4sale.com Copyright © A. Mark Argentino, P.Eng., Broker, RE/MAX Realty Specialists Inc., Brokerage, Mississauga, Ontario, Canada L5M 7A1 (905) 828-3434 First created - Tuesday, July 16th, 1996 at 3:48:41 PM - Last Update of this website: Wednesday, May 1, 2024 9:02 AM
At this Mississauga, (Erin Mills, Churchill Meadows, Sawmill Valley, Credit Mills and/ or Meadowvale ) Ontario, Canada Real Estate Homes and Property Internet web site you will find relevant information to help you and your family.
Why Subscribe? You will receive valuable Real Estate information on a monthly basis - such as: where to find the 'best' mortgage interest rates, Power of Sale Properties and graphs of current house price trends. Plus, you will pick up ideas, suggestions and excellent real estate advice when you sell or buy your next home.
Read Past Newsletters before you decide |