| | | | |
Report on last months NewsGTA Resale Housing Sales Up |
|
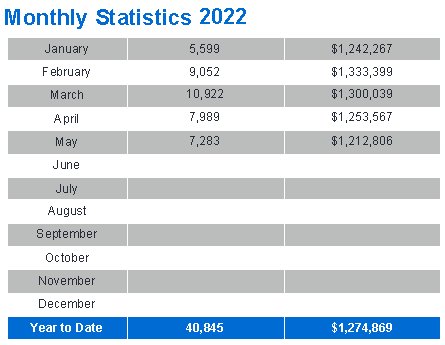
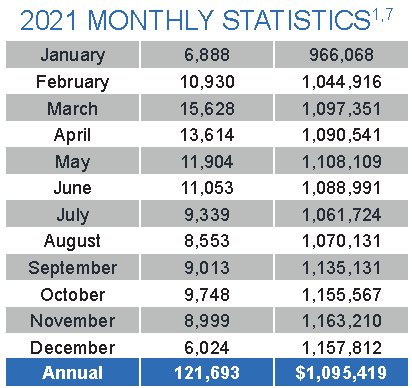
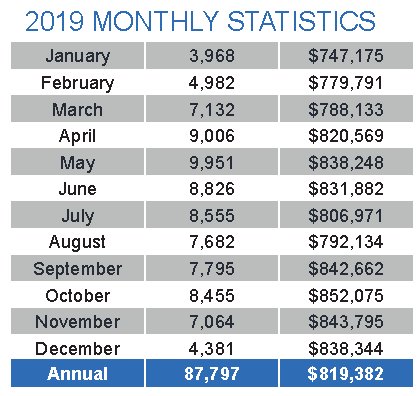
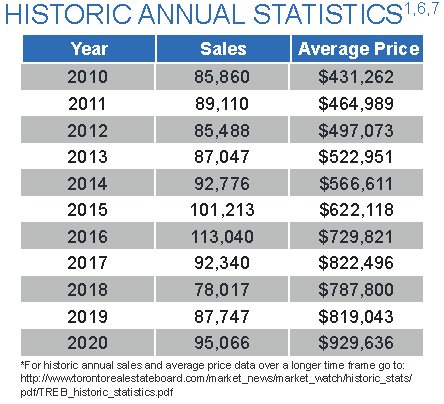
This charts below show the historical annual price and sales volumes to current month:
|
Report as of Tuesday, June 7, 2022In this Issue of my newsletter |
 This is the report for latest month in real estate sales from the Toronto Regional Real Estate Board and indicates a 'normal' amount of activity and price levels.
Below is the latest release of figures
Highlights of the latest report from TRREB for the Residential Real Estate Market in the GTA Real Estate Prices UP and Sales Volume DOWN - Mississauga and GTA Real Estate Newsletter June 2022 - Issue 06:07 This months Real Estate Update brings more positive news from our real estate market here in Mississauga, Toronto and the GTA. Enjoy and I wish you all the best! Mark
See more at this page about average prices and read the TRREB full price and data report below. |
|||
PRESS RELEASE: Sales & Price Growth Continue last monthSee the full press release below. Please refer to this page to see a graph of Average prices and More |
|||
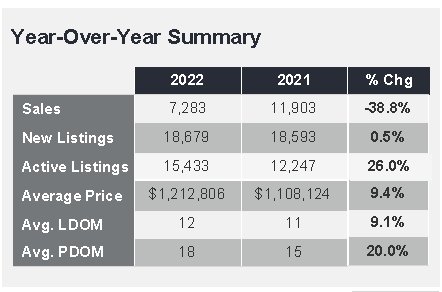
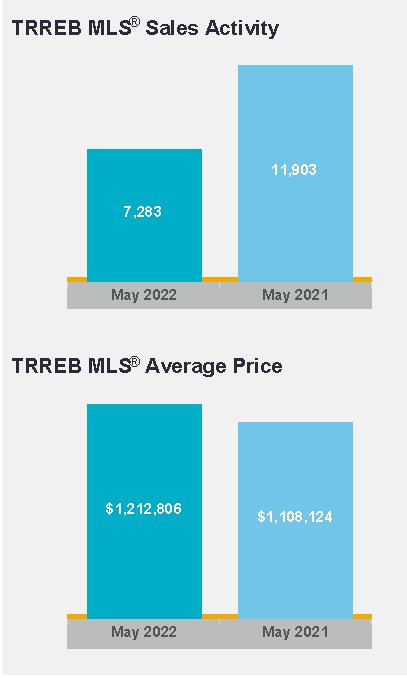
This is the full price and data report from TRREB for last monthGTA REALTORS® RELEASE MONTHLY RESALE HOUSING MARKET FIGURES TRREB RELEASES RESALE MARKET FIGURES AS REPORTED BY GTA REALTORS® GTA REALTORS Release May Stats TORONTO, ONTARIO, June 3, 2022 Greater Toronto Area (GTA) housing market conditions continued to evolve in response to higher borrowing costs. Similar to April results, May 2022 sales were down on a monthly and annual basis. Conversely, active listings at the end of May were up on a month-over-month and year-over-year basis. More balanced market conditions have provided buyers with more negotiating power. As a result, while benchmark and average home prices were up substantially compared to last year, selling prices trended lower on a month-over-month basis. Bank of Canada rate hikes, including the 50-basis point hike on June 1, are impacting home buyers in the short term. There is now a psychological aspect where potential buyers are waiting for a bottom in price. This will likely continue through the summer. However, as home buyers adjust to higher borrowing costs, housing demand will be supported by extremely low unemployment, high job vacancies, rising incomes and record immigration, said TRREB President Kevin Crigger. GTA REALTORS® reported 7,283 sales through TRREBs MLS® System in May 2022 down 38.8 per cent compared to May 2021 and down nine per cent compared to April 2022. The number of new May listings was similar to last years level and edged up on a month-over-month basis. With sales down and new listings trend flat to slightly up, the number of active listings was up on a year-overyear basis by 26 per cent. Market conditions remained tight enough to support an overall average selling price of $1,212,806 for May 2022, representing an annual growth rate of 9.4 per cent. The MLS® Home Price Index Composite Benchmark was also up on a year-over-year basis by 23.9 per cent. On a month-overmonth basis, both price metrics were lower, reflecting more balanced market conditions. Price trends observed over the past three months both in terms of moderating annual growth rates and the recent month-over-month dips are in line with TRREBs forecast for 2022. After a strong start to the year, the current rate tightening cycle has changed market dynamics, with many potential home buyers putting their purchase on hold. This has led to more balance in the market, providing buyers with more negotiating power, said TRREB Chief Market Analyst Jason Mercer. Mark |
|||
See the season trends in graphical form
I hope this finds you Happy and Healthy!
All the Best!
Mark
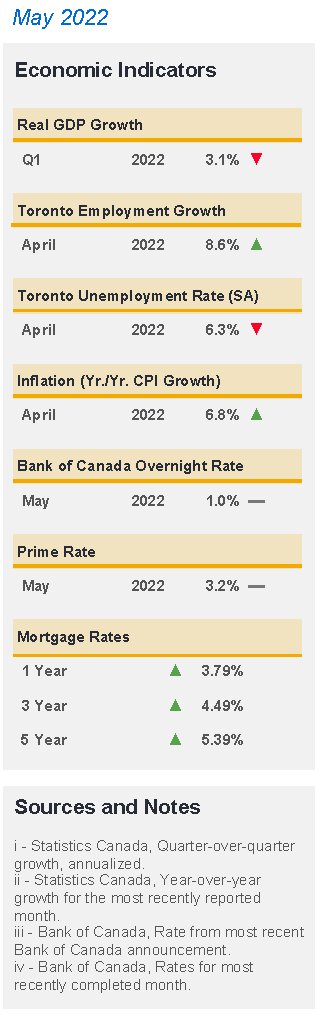
Read about Housing market indicators from last month
Summary of TorontoMLS Sales and Average Price
Sales by housing type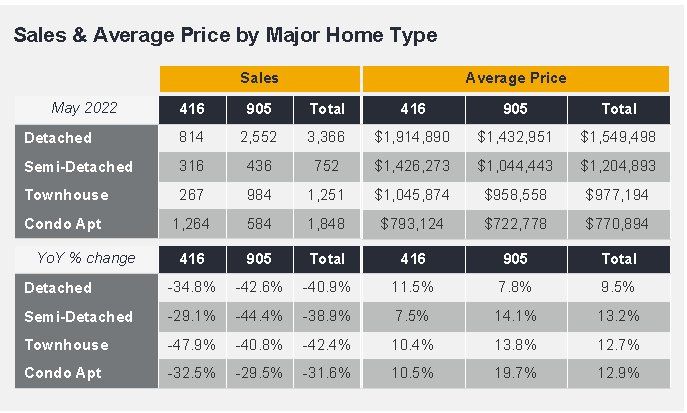
Below is a Graph showing TRREB Historical Average Price Data
|
|
|
See the Average Price Cycles from January 1995 to Date - a very interesting cyclical pattern is clearly seen!


See how the historical 1 year mortgage interest rate compares to the 5 year rate
This graph shows the 1989 real estate recession in the GTA and how long it took to recover from the drop in the average price from the peak price in February of 1989 to 2002

Statistics Canada, Quarter-over-quarter growth, on an annual basis, Statistics Canada, Year-over-year growth for the most recently reported month, Bank of Canada, Rate from most recent Bank of Canada announcement Bank of Canada, Rates for most recently completed month
Of Mississauga’s 240,660 households, 66,655 or 27.7 per cent were renters in 2016, earning an annual income of $58,272. The average cost of rent and utilities per month for Mississauga renters came in at $1,281 compared to $1,109 for the rest of Ontario.
Notes:
1 - Sales, dollar volume, average sale prices and median sale prices are based on firm transactions entered into the TRREB
MLS® system between the first and last day of the month/period being reported.
2 - New listings entered into the TRREB MLS® system between the first and last day of the month/period being reported.
3 - Active listings at the end of the last day of the month/period being reported.
4 - Ratio of the average selling price to the average listing price for firm transactions entered into the TRREB MLS® system
between the first and last day of the month/period being reported.
5 - Average Listing Days on Market (Avg. LDOM) refers to the average number of days sold listings were on the market.
Average Property Days on Market (Avg. PDOM) refers to the average number of days a property was on the market before
selling irrespective of whether the property was listed more than once by the same combination of seller and brokerage during
the original listing contract period.
6 - Active listings at the end of the last day of the month/period being reported.
7 - Past monthly and year-to-date figures are revised on a monthly basis.
8 - SNLR = Sales-to-New Listings Ratio. Calculated using a 12-month moving average (sales/new listings).
9 - Mos. Inv. = Months of Inventory. Calculated using a 12-month moving average (active listings/sales).
Historic Sales Figures
Rental Market indicators in the GTA
Mississauga MLS Real Estate Properties & MLS.CA Homes for Sale | All Pages including Mississauga Real Estate Blog all maintained by info@mississauga4sale.com Copyright © A. Mark Argentino, P.Eng., Broker, RE/MAX Realty Specialists Inc., Brokerage, Mississauga, Ontario, Canada L5M 7A1 (905) 828-3434 First created - Tuesday, July 16th, 1996 at 3:48:41 PM - Last Update of this website: Thursday, June 1, 2023 6:45 AM
At this Mississauga, (Erin Mills, Churchill Meadows, Sawmill Valley, Credit Mills and or Meadowvale ) Ontario, Canada Real Estate Homes and Property Internet web site you will find relevant information to help you and your family.
Why Subscribe? You will receive valuable Real Estate information on a monthly basis - such as: where to find the 'best' mortgage interest rates, Power of Sale Properties and graphs of current house price trends. Plus, you will pick up ideas, suggestions and excellent real estate advice when you sell or buy your next home.
Read Past Newsletters before you decide |