| | | | |
Report on last months NewsGTA Resale Housing Sales Up |
|
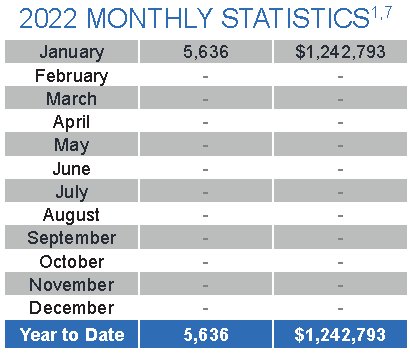
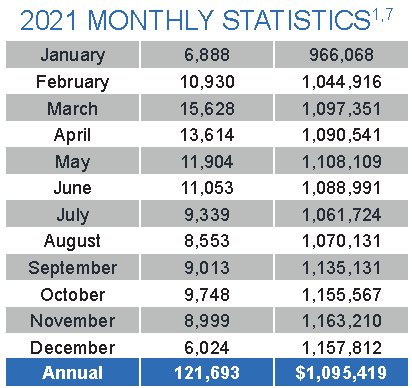
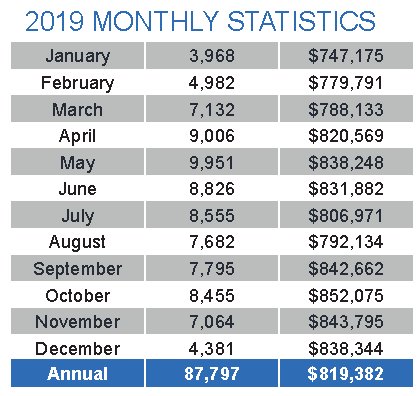
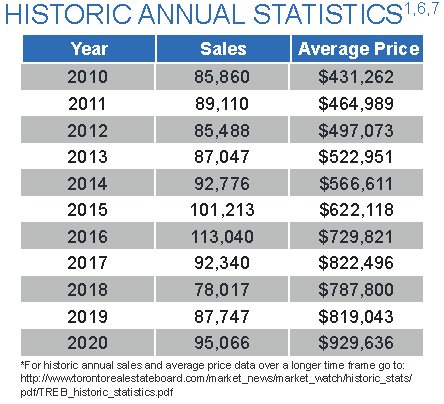
This charts below show the historical annual price and sales volumes to current month:
|
Report as of Monday, February 7, 2022In this Issue of my newsletter |
 This is the report for latest month in real estate sales from the Toronto Regional Real Estate Board and indicates a 'normal' amount of activity and price levels.
Below is the latest release of figures
Highlights of the latest report from TRREB for the Residential Real Estate Market in the GTA Real Estate Prices UP and Sales Volume DOWN - Mississauga and GTA Real Estate Newsletter February 2022 - Issue 02:07 This months Real Estate Update brings more positive news from our real estate market here in Mississauga, Toronto and the GTA. Enjoy and I wish you all the best! Mark
See more at this page about average prices and read the TRREB full price and data report below. |
|||
PRESS RELEASE: Sales & Price Growth Continue last monthSee the full press release below. Please refer to this page to see a graph of Average prices and More |
|||
This is the full price and data report from TRREB for last monthGTA REALTORS® RELEASE MONTHLY RESALE HOUSING MARKET FIGURES TRREB RELEASES RESALE MARKET FIGURES AS REPORTED BY GTA REALTORS® As part of a catch-up, I missed the January newsletter. The information below is from the January market watch and gives the 2021 annual results: GTA REALTORS® RELEASE DECEMBER STATS TORONTO, ONTARIO, January 6, 2022 – A record 121,712 sales were reported through TRREB’s MLS® System in 2021 – up 7.7 per cent from the previous 2016 high of 113,040 and up 28 per cent compared to 2020. Record demand last year was up against a constrained supply of listings, with new listings up by 6.2 per cent – a lesser annual rate than sales. The result was extremely tight market conditions and an all-time high average selling price of $1,095,475 – an increase of 17.8 per cent compared to the previous 2020 record of $929,636. “Despite continuing waves of COVID-19, demand for ownership housing sustained a record pace in 2021. Growth in many sectors of the economy supported job creation, especially in positions supporting above-average earnings. Added to this was the fact that borrowing costs remained extremely low. These factors supported not only a continuation in demand for groundoriented homes, but also a resurgence in the condo segment as well,” said TRREB President Kevin Crigger. One sales trend that stood out in 2021 compared to 2020 was the resurgence in demand for homes within the City of Toronto. Overall sales in the “416” area code were up by a substantially greater annual rate (+36.8 per cent) compared to sales growth for the surrounding Greater Toronto Area (GTA) suburbs combined (+23.6 per cent). The marked recovery in the condominium apartment segment was a key driver of this trend. “Tight market conditions prevailed throughout the GTA and broader Greater Golden Horseshoe in 2021, with a lack of inventory noted across all home types. The result was intense competition between buyers, pushing selling prices up by double digits year-over-year. Looking forward, the only sustainable way to moderate price growth will be to bring on more supply. History has shown that demand-side policies, such as additional taxation on principal residences, foreign buyers, and small-scale investors, have not been sustainable long-term solutions to housing affordability or supply constraints,” said In December, GTA REALTORS® reported 6,031 sales – a strong result historically, but still down by more than 1,000 transactions (-15.7 per cent) compared to the record of 7,154 set in December 2020. Over the same period, new listings were down by 11.9 per cent to 5,174. The MLS® Home Price Index Composite benchmark was up by 31.1 per cent yearover- year in December. The average selling price was up by 24.2 per cent annually to $1,157,849.
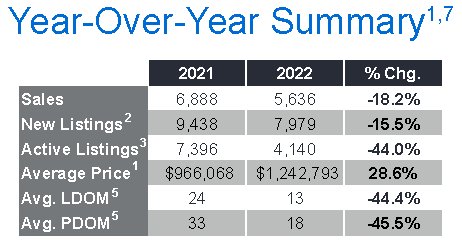
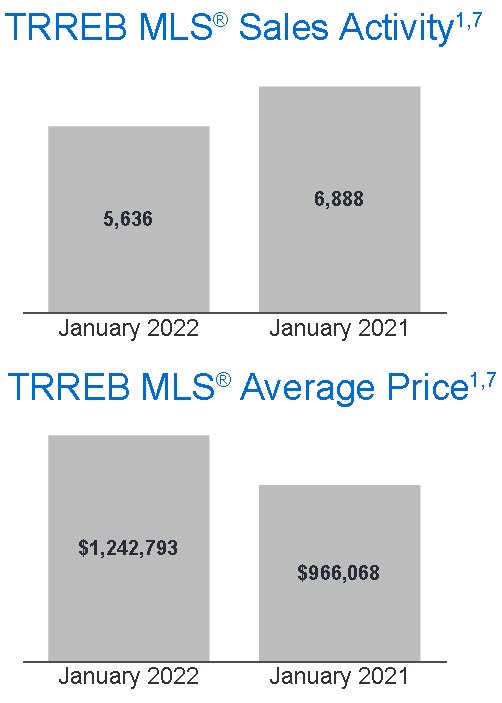
GTA REALTORS® RELEASE JANUARY STATS TORONTO, ONTARIO, February 3, 2022 Demand for ownership housing remained very strong from a historic perspective in January 2022. At the same time, listings remained in short supply, resulting in tight market conditions and very strong year-over-year price growth. The continuation of tight market conditions resulted in a 33.3 per cent annual increase in the MLS® Home Price Index Composite benchmark. Similarly, the average selling price was up by 28.6 per cent year-over-year to $1,242,793. There were 5,636 sales reported through the TRREB MLS® System in January 2022 down by 18.2 per cent compared to 6,888 sales in January 2021. While sales were down substantially compared last years record result, the January 2022 result was the second best in history for the month. This result is in line with TRREBs forecast for a strong sales result in 2022, but off the 2021 record. New listings were down by a similar annual rate (-15.5 per cent) as sales. Because sales and new listings moved in relative lock step, active listings at the end of January amounted to 4,140 down by 44 per cent to the lowest level in more than two decades. Looking Forward, TRREB's outlook for 2022 is as follows: Total home sales reported through TRREBs MLS® System in the GTA will reach 110,000, representing a dip from 2021, but still a strong result in comparison to previous years; and The average selling price for all home types combined is set to climb to $1,225,000, an approximate increase of 12 per cent when compared to last year. Mark |
|||
See the season trends in graphical form
I hope this finds you Happy and Healthy!
All the Best!
Mark
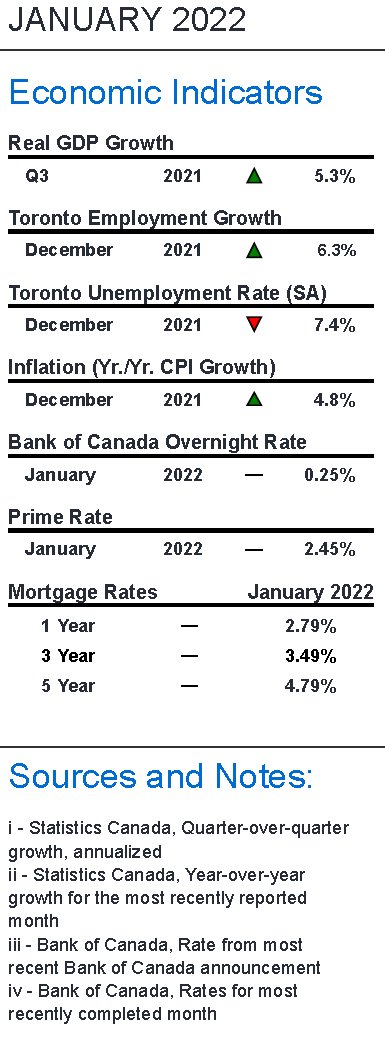
Read about Housing market indicators from last month
Summary of TorontoMLS Sales and Average Price
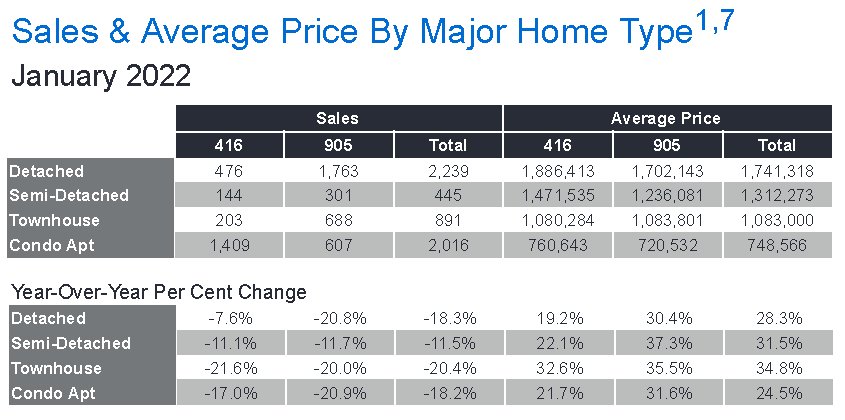
Sales by housing type
Below is a Graph showing TRREB Historical Average Price Data
|
|
|
See the Average Price Cycles from January 1995 to Date - a very interesting cyclical pattern is clearly seen!


See how the historical 1 year mortgage interest rate compares to the 5 year rate
This graph shows the 1989 real estate recession in the GTA and how long it took to recover from the drop in the average price from the peak price in February of 1989 to 2002

Statistics Canada, Quarter-over-quarter growth, on an annual basis, Statistics Canada, Year-over-year growth for the most recently reported month, Bank of Canada, Rate from most recent Bank of Canada announcement Bank of Canada, Rates for most recently completed month
Of Mississauga’s 240,660 households, 66,655 or 27.7 per cent were renters in 2016, earning an annual income of $58,272. The average cost of rent and utilities per month for Mississauga renters came in at $1,281 compared to $1,109 for the rest of Ontario.
Notes:
1 - Sales, dollar volume, average sale prices and median sale prices are based on firm transactions entered into the TRREB
MLS® system between the first and last day of the month/period being reported.
2 - New listings entered into the TRREB MLS® system between the first and last day of the month/period being reported.
3 - Active listings at the end of the last day of the month/period being reported.
4 - Ratio of the average selling price to the average listing price for firm transactions entered into the TRREB MLS® system
between the first and last day of the month/period being reported.
5 - Average Listing Days on Market (Avg. LDOM) refers to the average number of days sold listings were on the market.
Average Property Days on Market (Avg. PDOM) refers to the average number of days a property was on the market before
selling irrespective of whether the property was listed more than once by the same combination of seller and brokerage during
the original listing contract period.
6 - Active listings at the end of the last day of the month/period being reported.
7 - Past monthly and year-to-date figures are revised on a monthly basis.
8 - SNLR = Sales-to-New Listings Ratio. Calculated using a 12-month moving average (sales/new listings).
9 - Mos. Inv. = Months of Inventory. Calculated using a 12-month moving average (active listings/sales).
Historic Sales Figures
Rental Market indicators in the GTA
Mississauga MLS Real Estate Properties & MLS.CA Homes for Sale | All Pages including Mississauga Real Estate Blog all maintained by info@mississauga4sale.com Copyright © A. Mark Argentino, P.Eng., Broker, RE/MAX Realty Specialists Inc., Brokerage, Mississauga, Ontario, Canada L5M 7A1 (905) 828-3434 First created - Tuesday, July 16th, 1996 at 3:48:41 PM - Last Update of this website: Thursday, June 1, 2023 6:45 AM
At this Mississauga, (Erin Mills, Churchill Meadows, Sawmill Valley, Credit Mills and or Meadowvale ) Ontario, Canada Real Estate Homes and Property Internet web site you will find relevant information to help you and your family.
Why Subscribe? You will receive valuable Real Estate information on a monthly basis - such as: where to find the 'best' mortgage interest rates, Power of Sale Properties and graphs of current house price trends. Plus, you will pick up ideas, suggestions and excellent real estate advice when you sell or buy your next home.
Read Past Newsletters before you decide |