


| | | | |
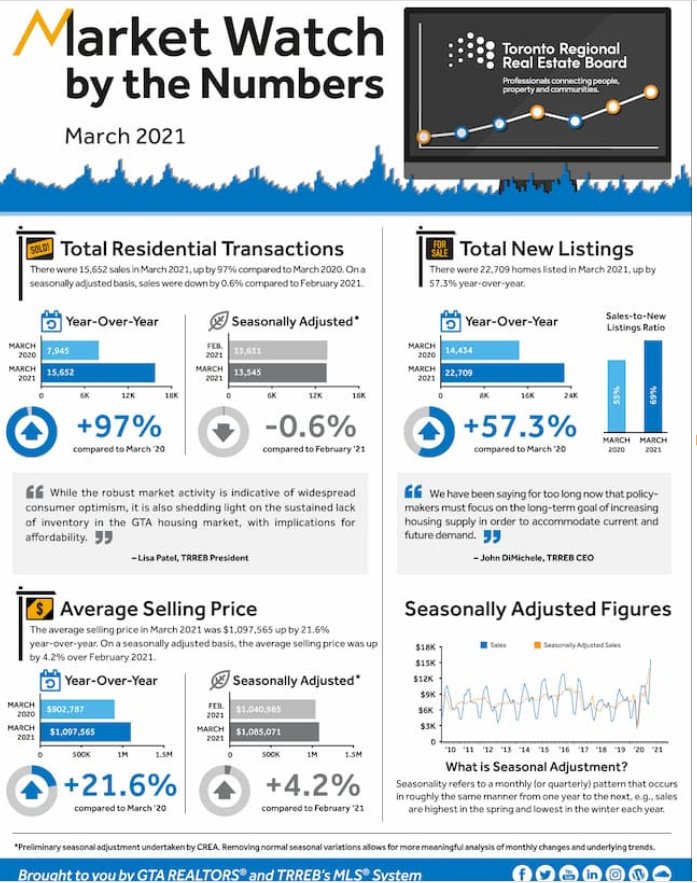
See current TRREB Figures here
See the season trends in graphical form
I hope this finds you Happy and Healthy!
All the Best!
Mark
Read about Housing market indicators from last month
Update: The figures are in for 2019 I've updated the graph below to reflect these changes....stay tuned!
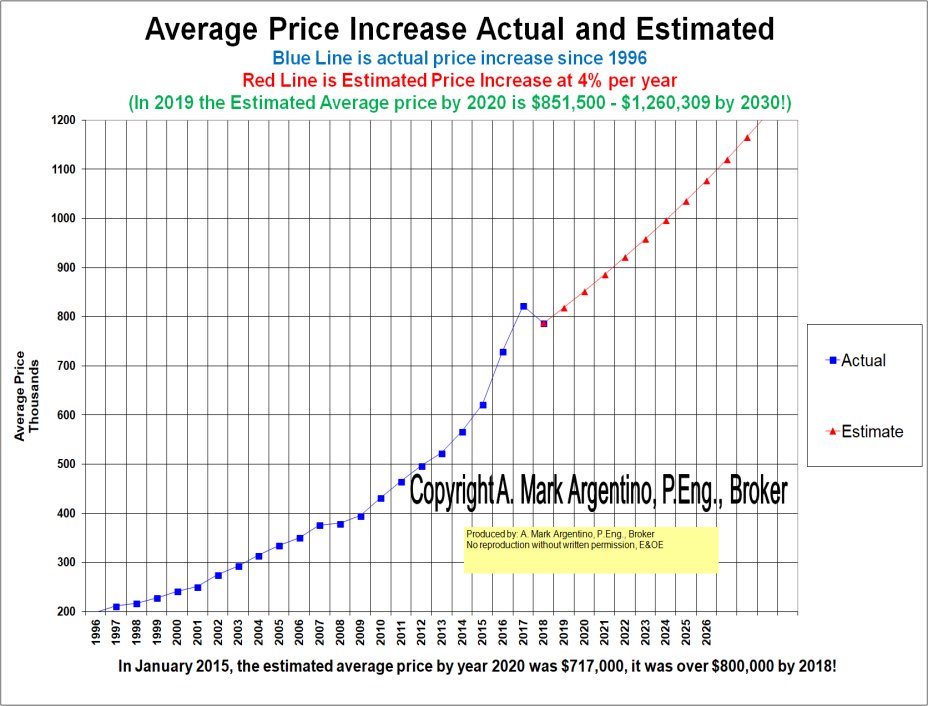
Average was estimated to be $717,000 by 2020 and the average price will be over $900,000 by 2026 !

Below were the estimates of the market increase in 2012


Breaking down the total Numbers into TREB Areas for this month
Please browse here if you wish to see all the TREB Sales stats for 2007
This graph shows the 1989 real estate recession in the GTA and how long it took to recover from the drop in the average price from the peak price in February of 1989 to 2002

Historic Sales Figures
Rental Market indicators in the GTA
This chart shows the breakdown of single family residential sales (detached, semi's, townhomes and condos) for last month.
TREB MLS® Active Residential Listings at Month-‐End
Notes:
1 - Sales, dollar volume, average sale prices and median sale prices are based on firm transactions entered into the TRREB
MLS® system between the first and last day of the month/period being reported.
2 - New listings entered into the TRREB MLS® system between the first and last day of the month/period being reported.
3 - Active listings at the end of the last day of the month/period being reported.
4 - Ratio of the average selling price to the average listing price for firm transactions entered into the TRREB MLS® system
between the first and last day of the month/period being reported.
5 - Average Listing Days on Market (Avg. LDOM) refers to the average number of days sold listings were on the market.
Average Property Days on Market (Avg. PDOM) refers to the average number of days a property was on the market before
selling irrespective of whether the property was listed more than once by the same combination of seller and brokerage during
the original listing contract period.
6 - Active listings at the end of the last day of the month/period being reported.
7 - Past monthly and year-to-date figures are revised on a monthly basis.
8 - SNLR = Sales-to-New Listings Ratio. Calculated using a 12-month moving average (sales/new listings).
9 - Mos. Inv. = Months of Inventory. Calculated using a 12-month moving average (active listings/sales).

Excellent, I am ready for an online evaluation
Mississauga MLS Real Estate Properties & MLS.CA Homes for Sale | All Pages including Mississauga Real Estate Blog all maintained by info@mississauga4sale.com Copyright © A. Mark Argentino, P.Eng., Broker, RE/MAX Realty Specialists Inc., Brokerage, Mississauga, Ontario, Canada L5M 7A1 (905) 828-3434 First created - Tuesday, July 16th, 1996 at 3:48:41 PM - Last Update of this website: Wednesday, May 1, 2024 9:02 AM
At this Mississauga, (Erin Mills, Churchill Meadows, Sawmill Valley, Credit Mills and/ or Meadowvale ) Ontario, Canada Real Estate Homes and Property Internet web site you will find relevant information to help you and your family.
Why Subscribe? You will receive valuable Real Estate information on a monthly basis - such as: where to find the 'best' mortgage interest rates, Power of Sale Properties and graphs of current house price trends. Plus, you will pick up ideas, suggestions and excellent real estate advice when you sell or buy your next home.
Read Past Newsletters before you decide |