


| | | | |
![]()

TORONTO - Wednesday, June 4, 2008 -- TREB Members saw 9,411 sales of single family dwellings in May, TREB President Maureen O’Neill announced today. “While off last year’s pace, a 9,000 plus sales month is certainly indicative of a healthy market,” said the President.
Prices trended upward on a year-over-year basis, with the overall average going to $398,148, up four per cent over the May 2007 figure of $382,787.
The City of Toronto experienced a three per cent increase, to $434,271 over last May’s $422,163. The 905 suburbs averaged $374,629, up five per cent over the same time last year, when the corresponding figure was $355,341.
“Furthermore, inventory has increased 15 per cent to 27,267 listings over May of 2007. This is good news for potential homebuyers as it should keep year-over-year price increases to the low single digits.”
Sales GTA-wide declined 16 per cent from May of 2007, which saw 11,146 sales, a record month. However, this overall decline masked significant regional variations.
Within the City of Toronto, sales fell 19 per cent to 3,711 from last May’s figure of 4,578. Within the 905 suburbs, on the other hand, the decline was a less pronounced 13 per cent, to 5,700 sales from last May’s figure of 6,568.
Breaking down the total, 3,626 sales were reported in TREB’s 28 West districts and averaged $377,098; 1,606 sales were reported in the 14 Central districts and averaged $528,938; 1,938 sales were reported in the 23 North districts and averaged $430,240; and 2,241 sales were reported in TREB’s 21 East districts and averaged $310,724.
Steady GTA Resale Housing Market in May
TORONTO, June 4, 2008 -- The Greater Toronto Area resale housing market recorded 9,411 transactions in May, Toronto Real Estate Board President Maureen O’Neill announced today.
On a year-over-year basis the GTA average price increased four per cent to $398,148 in May from the May 2007 average of $382,787. Prices increased three per cent in the City of Toronto to $434,271 from $422,163 during the same period a year ago, while in the 905 Region there was a five per cent increase to $374,629 from $355,341 last May.
“Price gains show that real estate continues to be a solid investment for the consumer,” said Ms. O’Neill. “We are confident about the market because employment in the GTA continues to be strong and interest rates remain low. As long as consumers have the financial resources to buy homes and a variety of choices to manage carrying costs, the market should remain stable.”
“May’s sales figures represent a 16 per cent decline in the GTA from the record month a year ago when 11,146 sales were recorded,” said Ms. O’Neill. “More than 9,000 properties changing hands still represents considerable market activity.”
In the City of Toronto, there were 3,711 sales, down 19 per cent from last May’s 4,578 sales and down 6 per cent from May 2006. In the 905 Region, 5,700 transactions were recorded, which represents a 13 per cent decline from the 6,568 sales during the same period a year ago but up 4 per cent from May 2006.
“The Toronto Land Transfer Tax has been in effect for four months and the decline in sales has been running for the same time period,” said Ms. O’Neill. “We’re keeping a close watch on the effect of this new tax.”
Two specific areas North of Toronto experienced increased sales activity in May. In Uxbridge (N16) sales were up 10 per cent, while Stouffville (N12) saw a 12 per cent increase in sales, driven mainly by detached home transactions.
Toronto
REALTORS® are passionate about their work. They adhere to a strict code of ethics and share a state-of-the-art Multiple Listing Service designed exclusively for REALTORS®.
Serving more than 24,000 Members in the Greater
Toronto Area, the Toronto Real Estate Board is Canada's
largest real estate board. Greater Toronto Area
open house listings are now available on www.TorontoRealEstateBoard.com.

See the Average Price Cycles
from January 1995 to Date - a very interesting cyclical pattern is clearly
seen!
See how the historical 1 year mortgage interest rate
compares to the 5 year rate

Breaking down the total Numbers into TREB Areas for this month
Please browse here if you wish to see all the TREB Sales stats for 2007
May 2008 Sales figures
April 2008 Sales figures
March 2008 Sales figures
February 2008 Sales figures
January 2008 Sales figures
Neighbourhood Corner - Mississauga - Each month The Toronto Real Estate Board profiles a neighbourhood and for January of 2006 TREB chose Mississauga!
There were 647 sales in Mississauga this January, a decline of three per cent over the first month of 2007. The average price came in at $339,655, a one per cent increase over the same time-frame last year. Of these sales, 196 were of detached homes which averaged $516,190, up eight per cent over January '07.
Mississauga (MLS districts W12 to W20) had 608 sales in January, up seven per cent over the figure recorded in January of 2005. These sales averaged $305,464, a two per cent increase over last January. Breaking down the total, there were 201 sales of detached homes, which averaged $448,889; there were 171 sales of condominium apartments, and the average for these was $193,481.
There were 569 sales in the Mississauga area during January, down 12 per cent from the figure recorded in January of 2004. The average price, however, rose seven per cent to $298,503. Breaking down the total, detached homes in Mississauga (203 sales) averaged about $418,655, while semis (121 sales) came in at $279,025.
The Mississauga area (W-12 through W-20) registered 645 sales in January, down 10 per cent from the 721 recorded during the same time-frame in 2003. However, the overall average in Mississauga came to $277,594, up seven percent over the $259,207 recorded in January of last year. Average days-on-market was 43, about the same as the Board-wide figure of 42.
In Mississauga (W-12 to W-20) the latter half of this year saw prices climb 10 per cent to $256,824 over the $233,151 recorded for the whole of 2001. Average Days-on-Market in Mississauga was 34, as compared to a city-wide average of 38 days.
Rental Market indicators in the GTA
This chart shows the breakdown of single family residential sales
for last month.
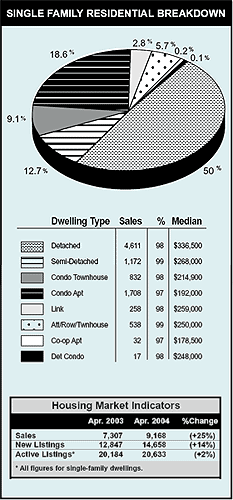
Housing Market Indicators |
||||
|
This month |
This month |
% Change |
|
Sales* |
8,084 |
7,329 |
(-9%) |
less sales |
New Listings* |
12,059 |
12,012 |
( -- ) |
equal listings |
Active Listings* |
20,063 |
22,368 |
(+11%) |
more listings all = softer market and prices |
* All figures above for Single-Family Dwellings.
|
February
28, 2008
|
|||
|
Region |
Area Sales |
Av. Price |
|
|
East |
391 |
$300,867 |
|
|
West |
627 |
$358,062 |
|
|
Central |
268 |
$504,817 |
|
|
North |
300 |
$419,670 |
|
|
Total |
1,586 |
$380,654 |
|
|
NOTE: Please note these are preliminary figures. Minor adjustments may be required at month's end. |
|||
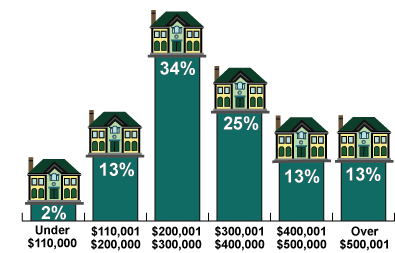
This is a graphical representation showing the percentage
of homes that sold in each price range.

Excellent, I am ready for an online evaluation
| |
Mississauga MLS Real Estate Properties & MLS.CA Homes for Sale | All Pages including Mississauga Real Estate Blog all maintained by info@mississauga4sale.com Copyright © A. Mark Argentino, P.Eng., Broker, RE/MAX Realty Specialists Inc., Brokerage, Mississauga, Ontario, Canada L5M 7A1 (905) 828-3434 First created - Tuesday, July 16th, 1996 at 3:48:41 PM - Last Update of this website: Thursday, June 1, 2023 6:45 AM
At this Mississauga, (Erin Mills, Churchill Meadows, Sawmill Valley, Credit Mills and or Meadowvale ) Ontario, Canada Real Estate Homes and Property Internet web site you will find relevant information to help you and your family.
Why Subscribe? You will receive valuable Real Estate information on a monthly basis - such as: where to find the 'best' mortgage interest rates, Power of Sale Properties and graphs of current house price trends. Plus, you will pick up ideas, suggestions and excellent real estate advice when you sell or buy your next home.
Read Past Newsletters before you decide |