


| | | | |
![]()
TORONTO - Monday, June 5, 2006. -- With 9,434 sales recorded last month, May 2006 has proven to be the best month ever recorded in the 86 year history of the Toronto Real Estate Board, TREB President John Meehan announced today. "The May figure is up over two per cent from May 2005, when 9,209 sales were recorded, and up almost two per cent over the previous best ever month, June 2004, when 9,275 sales were recorded. The Toronto re-sale market is as healthy as it has ever been."
The president noted that the average price came in at $365,537 last month, compared to April's $366,683. "The key is that 17,685 new listings came onto the system in May, which pushed total inventory levels to 26,220 active listings at month-end. Both figures are up considerably over their year ago levels (seven and five per cent, respectively), and this is keeping price inflation to a reasonable level."
This was the news release that was issued by the Toronto Real Estate Board regarding the strength of the May sales
May breaks all-time record
TORONTO, June 5, 2006 -- More Toronto Area homes changed hands during the month of May than in any other previous single month, Toronto Real Estate Board President John Meehan announced today. The 9,434 transactions that took place during the month were two per cent higher than last May and nearly two per cent above the previous monthly record of 9,275 sales set in June 2004.
“This result is very positive for a number of reasons,” Mr. Meehan said. “We are seeing strong sales totals, yet the pace is very steady and controlled which is a good sign. This speaks to the overall health of the GTA housing market.”
The Scarborough waterfront was one of the most active areas during the month as Guildwood and Scarborough Village saw 33 per cent more transactions than during May of last year. A strong increase in sales of condominiums and townhomes helped fuel the increase, though the majority of transactions were detached homes.
Willowdale, in North Toronto, saw 25 per cent more homes change hands than during May 2005, with condominiums showing the largest increase of any housing type.
Immediately north of Willowdale just outside Toronto city limits, Thornhill showed a 34 per cent increase in overall sales compared to last May.
Ted Tsiakopoulos, regional economist for the CMHC, noted that the larger economic picture shows the Toronto real estate market is a very healthy market to be in.
“Record resale volumes in May suggest that consumer confidence remains strong. A steady pace in home price appreciation, modest rate hikes and rising incomes have kept housing demand healthy across the GTA," Mr. Tsiakopoulos said.
Mr. Meehan agreed that confidence is high. “A big reason there is so much confidence in this market is the consistency it has shown month after month. Consumers are understanding that this is a market with a strong foundation, and that there is a lot of choice out there for established homeowners and first-time buyers alike.”
Toronto REALTORS® are passionate about their work. They adhere to a strict code of ethics and share a state-of-the-art Multiple Listing Service. Its 26,220 listings resulted in May’s 9,434 sales. Serving over 23,000 Members in the Greater Toronto Area, the Toronto Real Estate Board is Canada’s largest real estate board.

See the Average Price Cycles
from January 1995 to Date - a very interesting cyclical pattern is clearly
seen!
See how the historical 1 year mortgage interest rate
compares to the 5 year rate
Breaking down the total Numbers into TREB Areas for this month
March Sales figures:
February 2006 figures were:
Neighbourhood Corner - Mississauga - Each month The Toronto Real Estate Board profiles a neighbourhood and for January of 2006 TREB chose Mississauga!
Mississauga (MLS districts W12 to W20) had 608 sales in January, up seven per cent over the figure recorded in January of 2005. These sales averaged $305,464, a two per cent increase over last January. Breaking down the total, there were 201 sales of detached homes, which averaged $448,889; there were 171 sales of condominium apartments, and the average for these was $193,481.
There were 569 sales in the Mississauga area during January, down 12 per cent from the figure recorded in January of 2004. The average price, however, rose seven per cent to $298,503. Breaking down the total, detached homes in Mississauga (203 sales) averaged about $418,655, while semis (121 sales) came in at $279,025.
The Mississauga area (W-12 through W-20) registered 645 sales in January, down 10 per cent from the 721 recorded during the same time-frame in 2003. However, the overall average in Mississauga came to $277,594, up seven percent over the $259,207 recorded in January of last year. Average days-on-market was 43, about the same as the Board-wide figure of 42.
In Mississauga (W-12 to W-20) the latter half of this year saw prices climb 10 per cent to $256,824 over the $233,151 recorded for the whole of 2001. Average Days-on-Market in Mississauga was 34, as compared to a city-wide average of 38 days.
Housing prices in selected areas of the GTA | ||||
| Municipality | Standard Condo Apt. | Standard Two Storey House | Standard Town House | Senior Executive House |
| Brampton | 155,000 | 280,000 | 210,000 | 585,000 |
| Burlington | 181,000 | 275,000 | 181,000 | 490,000 |
| Markham | 260,000 | 358,000 | 245,000 | 465,000 |
| Mississauga | 185,000 | 290,000 | 206,500 | 490,000 |
| Oakville | 225,000 | 290,000 | 220,000 | 600,000 |
| Richmond Hill | 225,000 | 290,000 | 225,000 | 410,000 |
Toronto - Etobicoke (Islington Kingsway) |
210,000 | 415,000 | 232,000 | 640,000 |
| Toronto - Leaside | 250,000 | 645,000 | 350,000 | 950,000 |
| Source: Survey of Canadian House Prices, Fourth Quarter 2004 Prices as of Oct.-Dec. 2004 (CDN $) | ||||
Rental Market indicators in the GTA
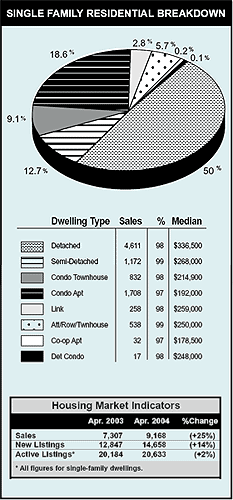
This chart shows the breakdown of single family residential sales
for last month.
Housing Market Indicators |
||||
|
This month |
This month |
% Change |
|
Sales* |
8,084 |
7,329 |
(-9%) |
less sales |
New Listings* |
12,059 |
12,012 |
( -- ) |
equal listings |
Active Listings* |
20,063 |
22,368 |
(+11%) |
more listings all = softer market and prices |
* All figures above for Single-Family Dwellings.
Totals for this last month
| Dwelling Type |
Sales |
% |
Median |
| Detached |
4,622 |
98 |
$340,000 |
| Semi Detached |
1,171 |
99 |
$271,000 |
| Condo Townhouse |
865 |
98 |
$214,000 |
| Condo Apt. |
1,643 |
97 |
$191,000 |
| Link |
250 |
98 |
$256,250 |
| Attached Row Townhouse |
596 |
99 |
$254,750 |
| Co-op Apt. |
37 |
97 |
$166,000 |
| Detached Condo |
9 |
97 |
$214,000 |
This is a graphical representation showing the percentage
of homes that sold in each price range.

Excellent, I am ready for an online evaluation
| |
Mississauga MLS Real Estate Properties & MLS.CA Homes for Sale | All Pages including Mississauga Real Estate Blog all maintained by info@mississauga4sale.com Copyright © A. Mark Argentino, P.Eng., Broker, RE/MAX Realty Specialists Inc., Brokerage, Mississauga, Ontario, Canada L5M 7A1 (905) 828-3434 First created - Tuesday, July 16th, 1996 at 3:48:41 PM - Last Update of this website: Thursday, June 1, 2023 6:45 AM
At this Mississauga, (Erin Mills, Churchill Meadows, Sawmill Valley, Credit Mills and or Meadowvale ) Ontario, Canada Real Estate Homes and Property Internet web site you will find relevant information to help you and your family.
Why Subscribe? You will receive valuable Real Estate information on a monthly basis - such as: where to find the 'best' mortgage interest rates, Power of Sale Properties and graphs of current house price trends. Plus, you will pick up ideas, suggestions and excellent real estate advice when you sell or buy your next home.
Read Past Newsletters before you decide |