| | | | |
Report on last months NewsGTA Resale Housing Sales Up |
|
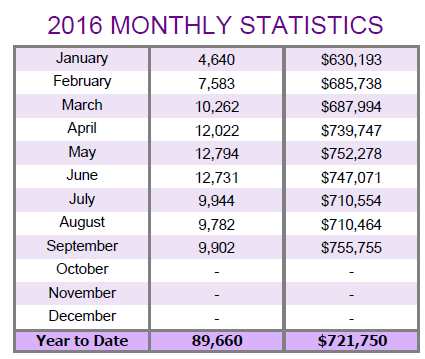
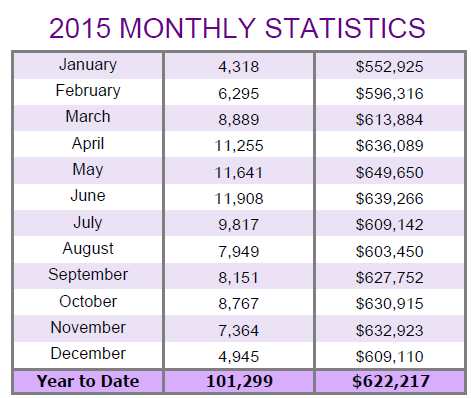
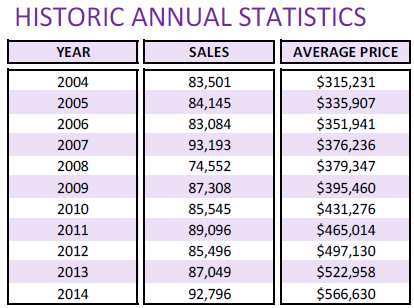
This charts below show the historical annual price and sales volumes to current month:
|
Report as of Monday, October 10, 2016In this Issue of my newsletter |
 This is the report for latest month in real estate sales from the Toronto real estate board and indicates a 'normal' amount of activity and price levels.
Below is the latest release of figures
Highlights of the latest report from TREB for the Residential Real Estate Market in the GTA
See more at this page about average prices and read the TREB full price and data report below. |
|
PRESS RELEASE: Sales & Price Growth Continue last monthSee the full press release below. Please refer to this page to see a graph of Average prices and More |
|
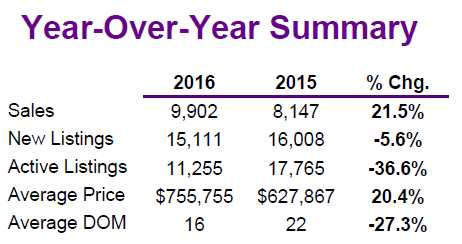
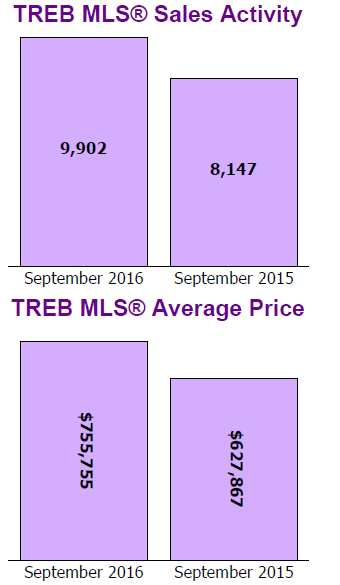
This is the full price and data report from TREB for last monthStrong Sales & Price Growth in September GTA REALTORS® RELEASE MONTHLY RESALE HOUSING MARKET FIGURES TORONTO, October 5, 2016 - Toronto Real Estate Board President Larry Cerqua announced that Greater Toronto Area REALTORS® reported 9,902 sales through TREB’s MLS® System in September 2016. This result was up by 21.5 per cent compared to September 2015. For the region as a whole, strong annual rates of sales growth were experienced for all major home types. The pace of detached sales growth was slower in the City of Toronto and the number of semi-detached sales was down compared to last year. In both cases, the year-over-year dip in new listings was likely the issue. “We continued to see strong demand for ownership housing up against a short supply of listings in the Greater Toronto Area in September. The sustained lack of inventory in many neighbourhoods across the GTA continued to underpin high rates of price growth for all home types,” said Mr. Cerqua. Both the MLS® Home Price Index (HPI) Composite Benchmark and the average selling price for all home types combined were up strongly on a year-over-year basis in September. The MLS® HPI Composite Benchmark grew by 18 per cent compared to September 2015. The average selling price was up by 20.4 per cent to $755,755. It is important to remember that the MLS® HPI provides a price growth measure for a benchmark home, thereby allowing for an apples-to-apples comparison from one year to the next. The average selling price can be influenced by changes in both market conditions and the mix of homes sold. “The Toronto Real Estate Board will be closely monitoring how the recent changes to Federal mortgage lending guidelines and capital gains tax exemption rules impact the housing market in the Greater Toronto Area. While these changes are pointed at the demand for ownership housing, it is important to note that much of the upward pressure on home prices in the GTA has been based on the declining inventory of homes available for sale,” said Jason Mercer, TREB’s Director of Market Analysis All the Best! Mark |
|
This chart plots the monthly MLS average home price for the current year and the previous three years. The recurring seasonal trend can be seen along with comparisons to previous years for each month. You can click the thumbnail below to see a larger printable version. As well, you can see the season trends in graphical form
I hope this finds you Happy and Healthy!
All the Best!
Mark
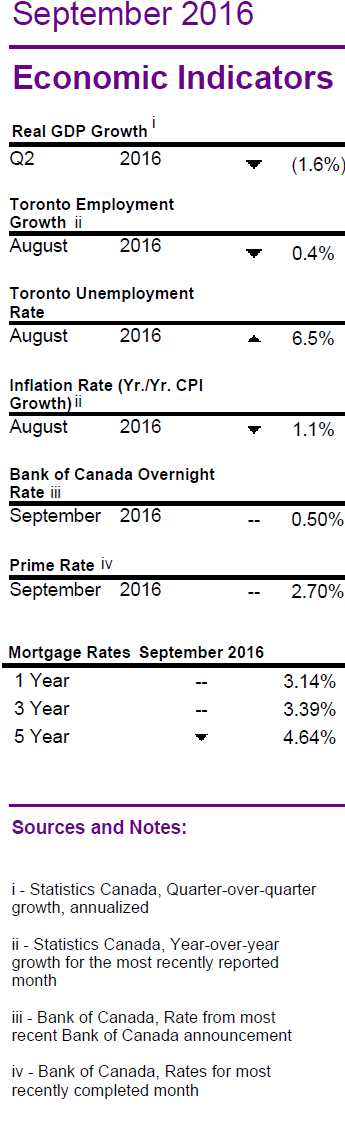
Read about Housing market indicators from last month
Summary of TorontoMLS Sales and Average Price
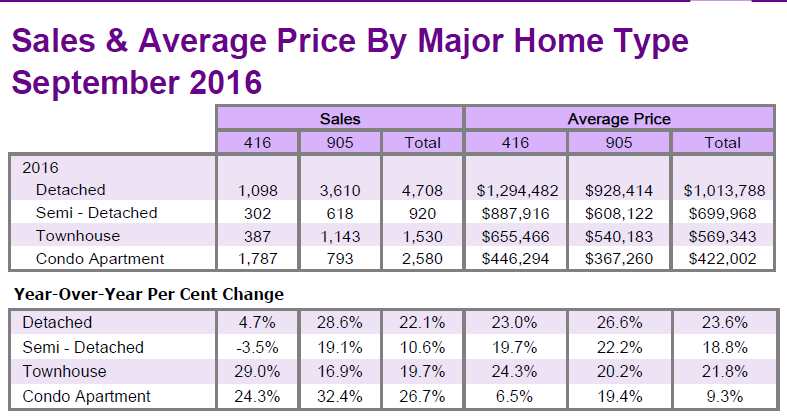
Sales by housing type
Below is a Graph showing TREB Historical Average Price Data
|
|
|
See the Average Price Cycles from January 1995 to Date - a very interesting cyclical pattern is clearly seen!


See how the historical 1 year mortgage interest rate compares to the 5 year rate
Update: The figures are in for 2012 and the average price was $479,000, I've updated the graph below to reflect these changes....stay tuned!

Below is the estimate as of 2012


Breaking down the total Numbers into TREB Areas for this month
Please browse here if you wish to see all the TREB Sales stats for 2007
This graph shows the 1989 real estate recession in the GTA and how long it took to recover from the drop in the average price from the peak price in February of 1989 to 2002

Statistics Canada, Quarter-over-quarter growth, on an annual basis, Statistics Canada, Year-over-year growth for the most recently reported month, Bank of Canada, Rate from most recent Bank of Canada announcement Bank of Canada, Rates for most recently completed month
Historic Sales Figures
Rental Market indicators in the GTA
This chart shows the breakdown of single family residential sales for last month.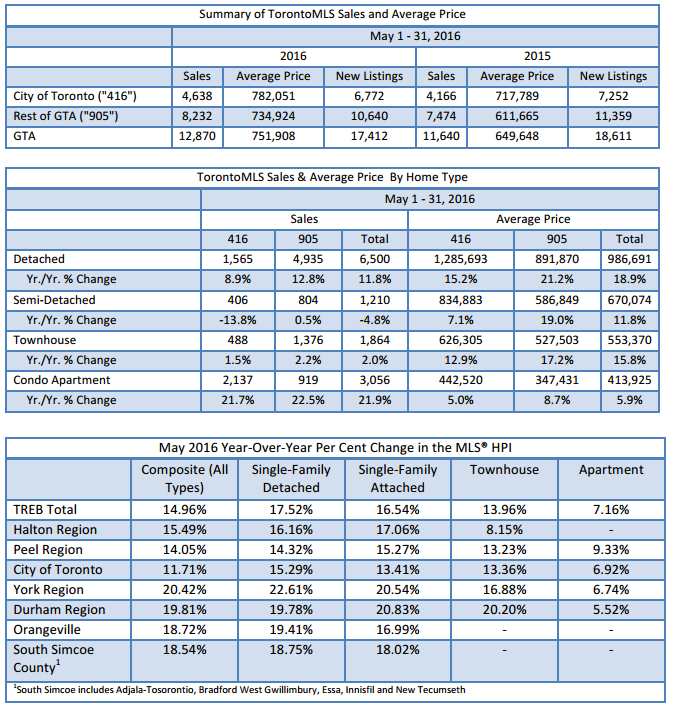

Excellent, I am ready for an online evaluation
Mississauga MLS Real Estate Properties & MLS.CA Homes for Sale | All Pages including Mississauga Real Estate Blog all maintained by info@mississauga4sale.com Copyright © A. Mark Argentino, P.Eng., Broker, RE/MAX Realty Specialists Inc., Brokerage, Mississauga, Ontario, Canada L5M 7A1 (905) 828-3434 First created - Tuesday, July 16th, 1996 at 3:48:41 PM - Last Update of this website: Thursday, June 1, 2023 6:45 AM
At this Mississauga, (Erin Mills, Churchill Meadows, Sawmill Valley, Credit Mills and or Meadowvale ) Ontario, Canada Real Estate Homes and Property Internet web site you will find relevant information to help you and your family.
Why Subscribe? You will receive valuable Real Estate information on a monthly basis - such as: where to find the 'best' mortgage interest rates, Power of Sale Properties and graphs of current house price trends. Plus, you will pick up ideas, suggestions and excellent real estate advice when you sell or buy your next home.
Read Past Newsletters before you decide |