

| | | | |
Report on last months NewsGTA Resale Housing Sales Up |
|
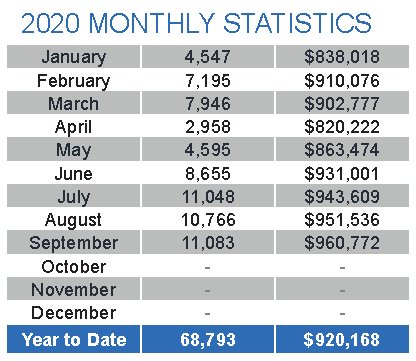
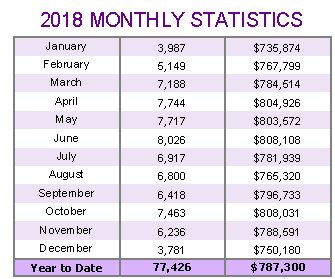
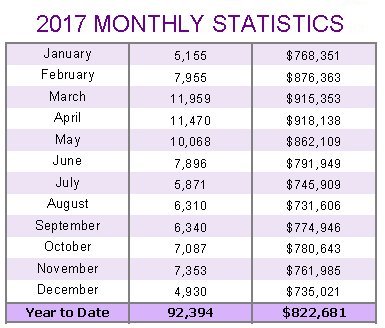
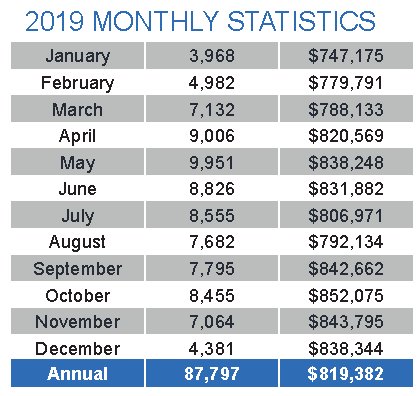
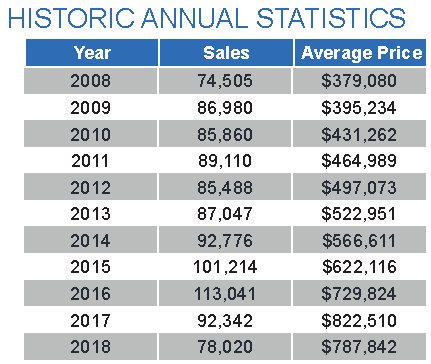
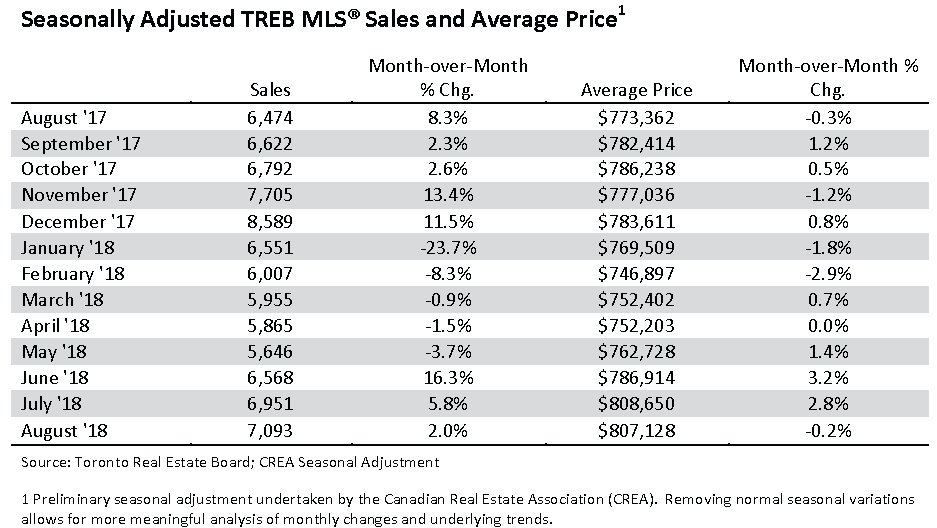
This charts below show the historical annual price and sales volumes to current month:
|
Report as of Thursday, December 17, 2020In this Issue of my newsletter |
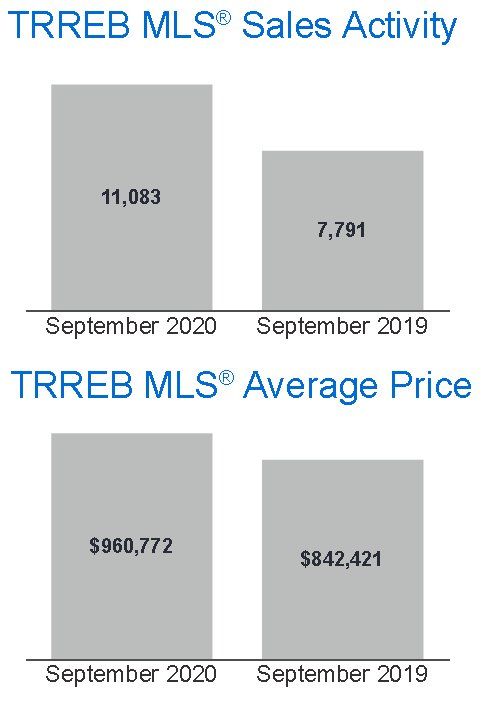
 This is the report for latest month in real estate sales from the Toronto real estate board and indicates a 'normal' amount of activity and price levels.
Below is the latest release of figures
Highlights of the latest report from TREB for the Residential Real Estate Market in the GTA Real Estate Prices UP and Sales Volume UP - Mississauga and GTA Real Estate Newsletter November 2020 - Issue 11:09 This months Real Estate Update brings more positive news from our real estate market here in Mississauga, Toronto and the GTA. Enjoy and I wish you all the best! Mark
See more at this page about average prices and read the TREB full price and data report below. |
|
PRESS RELEASE: Sales & Price Growth Continue last monthSee the full press release below. Please refer to this page to see a graph of Average prices and More |
|
This is the full price and data report from TREB for last monthGTA REALTORS® RELEASE MONTHLY RESALE HOUSING MARKET FIGURES TREB RELEASES RESALE MARKET FIGURES AS REPORTED BY GTA REALTORS® GTA REALTORS® RELEASE OCTOBER STATS TORONTO, ON, November 4, 2020 Home sales in the Greater Toronto Area (GTA) were up again year-over-year for the fourth month in a row. Our Members made 10,563 sales as reported through the Toronto Regional Real Estate Boards MLS® System in October 2020. This was up by 25.1 per cent compared to 8,445 transactions in October 2019. Sales and new listings reached record levels for the month of October. However, year-over-year growth rates for sales and new listings diverged in some market segments. In the detached market segment, the pace of annual sales growth far outstripped growth in new listings. Conversely, the condominium apartment market segment experienced more than double the new listings compared to October 2019, whereas sales were only up by 2.2 per cent over the same period. Competition between buyers of single-family homes, and particularly detached houses, remained strong last month and continued to support double-digit annual rates of price growth in many GTA neighborhoods. In contrast, condo buyers have benefitted from much more choice compared to last year. Pre-COVID polling had already pointed to an increase in investor selling in 2020. The pandemic only added to this trend with a stall in economic growth and a halt to tourism impacting cashflows for many investors, said Lisa Patel, TRREBs President. The MLS® HPI Composite Benchmark was up by 10.8 per cent on a year-over-year basis in October 2020. The average selling price for all home types combined was $968,318 up by 13.7 per cent compared to $851,877 in October 2019. Year-to-date home sales through October were above last years level. The economic recovery in some sectors coupled with low borrowing costs has kept home purchases top-of-mind for many GTA residents. With this being said, we have not accounted for all of the pent-up demand that resulted from the spring downturn. Expect record or near-record home sales for the remainder of 2020, said Jason Mercer, TRREBs Chief Market Analyst. Mark |
|
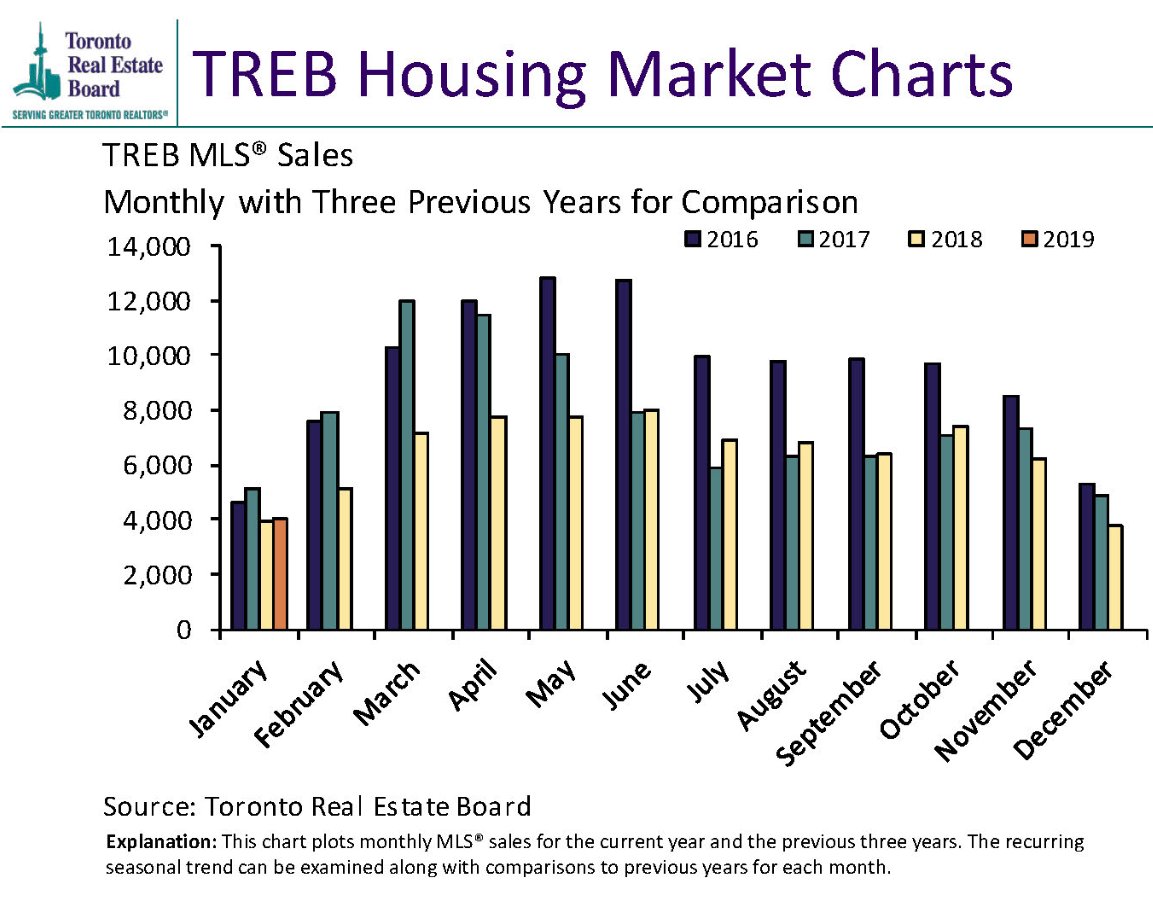
See the season trends in graphical form
I hope this finds you Happy and Healthy!
All the Best!
Mark
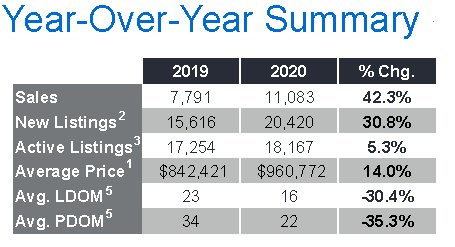
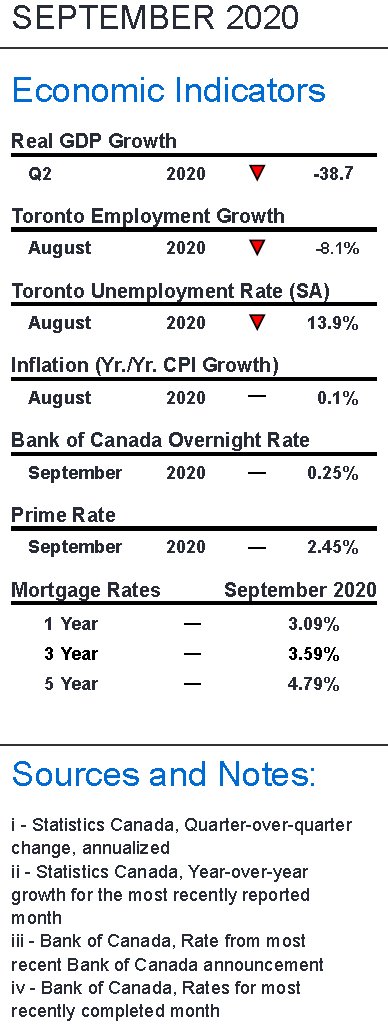
Read about Housing market indicators from last month
Summary of TorontoMLS Sales and Average Price
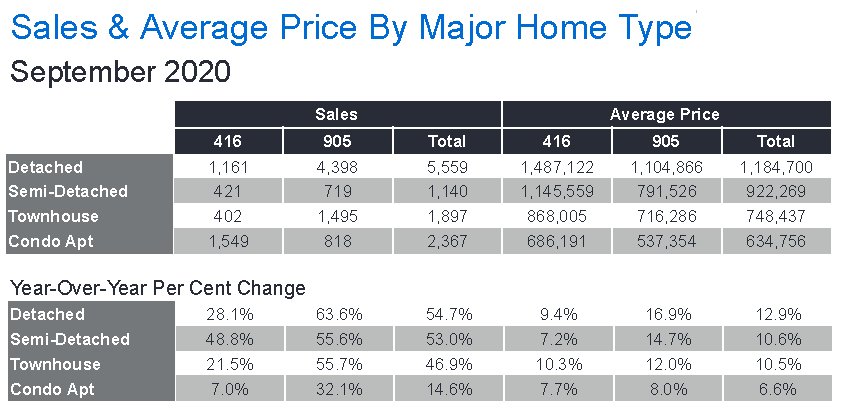
Sales by housing type
Below is a Graph showing TREB Historical Average Price Data
|
|
|
See the Average Price Cycles from January 1995 to Date - a very interesting cyclical pattern is clearly seen!


See how the historical 1 year mortgage interest rate compares to the 5 year rate
Update: The figures are in for 2019 I've updated the graph below to reflect these changes....stay tuned!
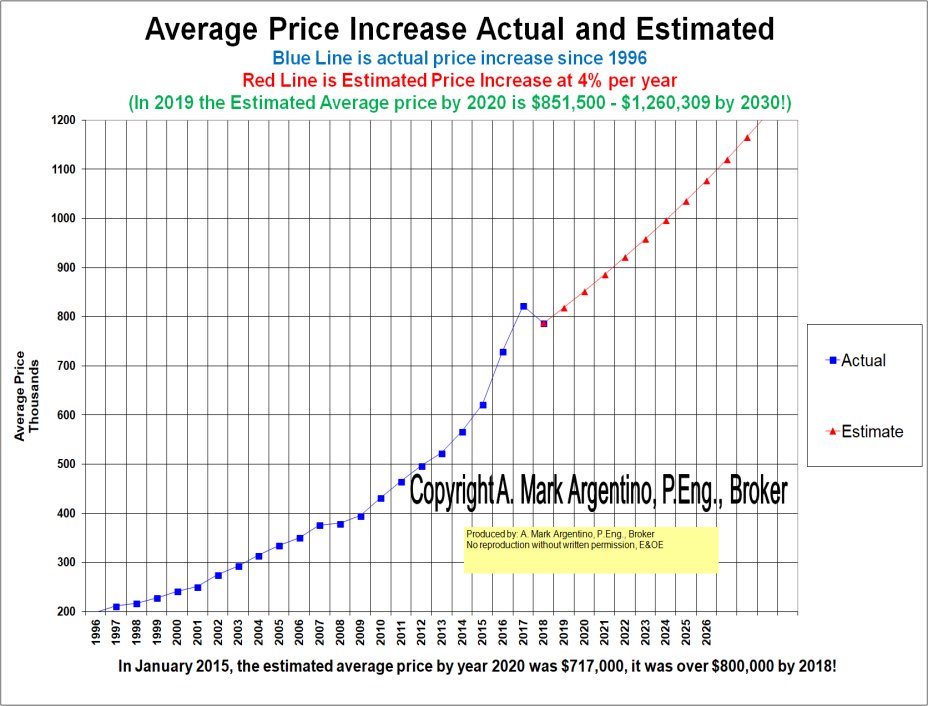
Average was estimated to be $717,000 by 2020 and the average price will be over $900,000 by 2026 !

Below were the estimates of the market increase in 2012


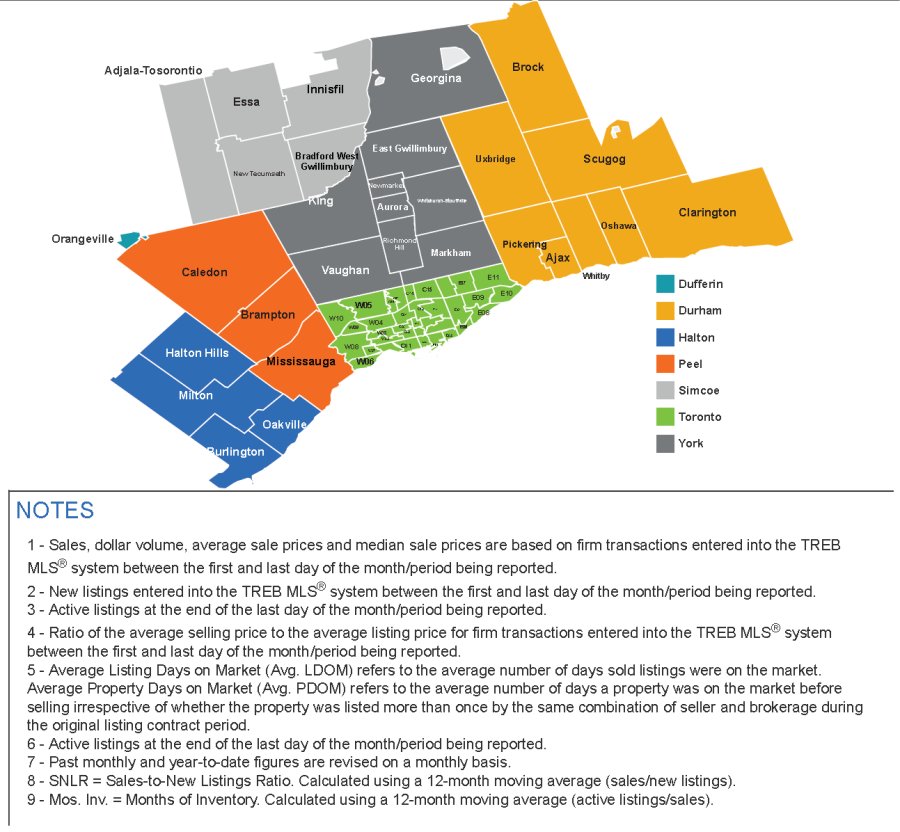
Breaking down the total Numbers into TREB Areas for this month
Please browse here if you wish to see all the TREB Sales stats for 2007
This graph shows the 1989 real estate recession in the GTA and how long it took to recover from the drop in the average price from the peak price in February of 1989 to 2002

Statistics Canada, Quarter-over-quarter growth, on an annual basis, Statistics Canada, Year-over-year growth for the most recently reported month, Bank of Canada, Rate from most recent Bank of Canada announcement Bank of Canada, Rates for most recently completed month
Of Mississauga’s 240,660 households, 66,655 or 27.7 per cent were renters in 2016, earning an annual income of $58,272. The average cost of rent and utilities per month for Mississauga renters came in at $1,281 compared to $1,109 for the rest of Ontario.
Historic Sales Figures
Rental Market indicators in the GTA
This chart shows the breakdown of single family residential sales (detached, semi's, townhomes and condos) for last month.
TREB MLS® Active Residential Listings at Month-‐End

Excellent, I am ready for an online evaluation
Mississauga MLS Real Estate Properties & MLS.CA Homes for Sale | All Pages including Mississauga Real Estate Blog all maintained by info@mississauga4sale.com Copyright © A. Mark Argentino, P.Eng., Broker, RE/MAX Realty Specialists Inc., Brokerage, Mississauga, Ontario, Canada L5M 7A1 (905) 828-3434 Google First created - Tuesday, July 16th, 1996 at 3:48:41 PM - Last Update of this website: Thursday, December 17, 2020 9:24 PM
At this Mississauga, (Erin Mills, Churchill Meadows, Sawmill Valley, Credit Mills and or Meadowvale ) Ontario, Canada Real Estate Homes and Property Internet web site you will find relevant information to help you and your family.
Why Subscribe? You will receive valuable Real Estate information on a monthly basis - such as: where to find the 'best' mortgage interest rates, Power of Sale Properties and graphs of current house price trends. Plus, you will pick up ideas, suggestions and excellent real estate advice when you sell or buy your next home.
Read Past Newsletters before you decide |