


| | | | |
![]()

The average price increased about 2% in 2008 compared to 2007 average prices. This is a little less than most were predicting for 2008, but still, it was a fairly good year in real estate in Toronto and the GTA in 2008.
It appears the boom that has been going on since 1995 is over. We are clearly in a buyers market now and this could continue for at least the next 1 or 2 quarters, maybe longer. Only time will tell.
This is the latest report from TREB on the past month and year.
The average price in December of 2008 came in at $361,415, compared to $394,931 in 2007, and $336,217 in December of 2006. For 2008 as a whole, prices averaged $379,347, compared to the $376,236 recorded in 2007, and the $351,941 average recorded in 2006.
TORONTO, January 9, 2009 –Toronto Real Estate Board Members reported 2,577 sales in December 2008, compared to the 4,646 recorded during the same month in 2007, and the 4,447 recorded in December 2006, TREB President Maureen O’Neill announced today. “Sales for the whole of 2008 were 74,552, compared to the 93,193 recorded in 2007, and the 83,084 recorded during 2006.”
The average price in the city was $387,482 compared to the $425,842 recorded in December of 2007 and the $350,139 recorded in December 2006. For all of 2008 the average was $410,271. In 2007 the comparable figure was $412,480, and in 2006 $378,776.
The 905 area saw 1,472 sales in December, from 2,344 in December of 2007 and 2,620 in December of 2006. For all of 2008, there were 44,674 sales in this region, versus 54,141 in 2007 and 48,680 in 2006.
The average price in the 905 was $341,847 in December, compared to $360,307 in 2007 and $326,509 in 2006. For all of 2008, the average was $358,665, as compared to $350,092 in 2007 and $332,976 in 2006.
The City of Toronto (416) recorded 1,105 sales in December, compared to 2,302 in December 2007 and 1,827 in December of 2006. For all of 2008, there were 29,878 sales, compared to 39,052 in 2007 and 34,404 in 2006.
Breaking down the total, 993 sales were reported in TREB’s 28 West districts and averaged $338,855; 473 sales were reported in the 14 Central districts and averaged $479,095; 491 sales were reported in the 23 North districts and averaged $381,975; and 620 sales were reported in TREB’s 21 East districts and averaged $291,488.
Median Price
The median price for December was $305,000, compared to $320,950 in 2007 and $290,000 in 2006.
The Median for the year as a whole was $325,000, as opposed to $318,200 in 2007 and $299,000 in 2006.
This was the release in Decembr , GTA Resale Housing Market Continues to Reflect Economic Times
TORONTO, December 04, 2008 -- Greater Toronto REALTORS® recorded 3,640 transactions last month, from 7,313 sales in November 2007, Toronto Real Estate Board President Maureen O’Neill announced today.
Year-to-date sales figures for the Greater Toronto Area show 72,086 transactions in 2008, from 88,695 sales recorded in the same January to November period a year ago. By contrast, the 2008 year-to-date average price in the GTA is $379,489, from $375,445 in 2007.
“Its important for the public to understand that while sales activity has moderated in 2008, due to current economic conditions, the average price of homes has increased from 2006 still making real estate a solid long term investment,” said O’Neill.
In the 416 area, 1,523 transactions took place last month, from 3,426 sales recorded in November 2007. From a year-to-date perspective, there have been 28,806 sales in the 416 area this year, from 36,804 transactions a year ago.
In the 905 Region 2,117 homes changed hands last month, from November 2007’s 3,887 sales. The 905 Region’s year-to-date figures show 43,280 transactions this year, from 51,891 sales recorded during the same period in 2007.
“Homeownership in the Greater Toronto Area continues to be an affordable, stable and secure investment,” said Ms. O’Neill. “Home buyers and sellers should be confident about their bricks and mortar investment which provides shelter and a place to raise a family.”
“Home prices are affordable, interest rates are at historical low levels and the supply of homes for sale is good providing additional reasons for buyers thinking of entering the market,” added O’Neill.
The average price of a home in the GTA last month was $368,582, from $393,747 noted in November 2007. In November 2006 the average price was recorded at $355,727.
In the 416 area, last month’s average price was $390,225, from $433,859 noted in November 2007. The average price recorded in November 2006 was $381,188. From a year-to-date perspective the 2008 average price in the 416 area is $411,155, from last year’s $411,640.
In the 905 Region, the average price recorded last month was $353,012, from $358,391 recorded in November of 2007. In November 2006 the average price was $335,522. The year-to-date average price in the 905 Region this year is $359,245, from $349,774 in 2007.
The average number of days a home currently remains on the market in the GTA is 41, from an average of 32 days last November. There are currently 27,037 homes listed on the TorontoMLS system compared to 18,309 available properties in November 2007.
“While homeownership offers immediate benefits and long term value by way of equity, it also provides tax benefits over time,” said Ms. O’Neill. “If you bought a house five years ago, it would be worth more than 20 per cent more today.”
“As REALTORS®, we help build communities and will continue to do so even during challenging economic times,” added Ms. O’Neill. “It’s important to consult with a REALTOR® to get accurate local market information.”
Greater Toronto REALTORS® are passionate about their work. They adhere to a strict Code of Ethics and share a state-of-the-art Multiple Listing Service. Serving over 28,000 Members in the Greater Toronto Area, the Toronto Real Estate Board is Canada’s largest real estate board.
Toronto
REALTORS® are passionate about their work. They adhere to a strict code of ethics and share a state-of-the-art Multiple Listing Service designed exclusively for REALTORS®.
Serving more than 24,000 Members in the Greater
Toronto Area, the Toronto Real Estate Board is Canada's
largest real estate board. Greater Toronto Area
open house listings are now available on www.TorontoRealEstateBoard.com.

See the Average Price Cycles
from January 1995 to Date - a very interesting cyclical pattern is clearly
seen!
See how the historical 1 year mortgage interest rate
compares to the 5 year rate

Breaking down the total Numbers into TREB Areas for this month
Please browse here if you wish to see all the TREB Sales stats for 2007
October 2008 Sales figures
September 2008 Sales figures
August 2008 Sales figures
July 2008 Sales figures
May 2008 Sales figures
April 2008 Sales figures
March 2008 Sales figures
February 2008 Sales figures
January 2008 Sales figures
Neighbourhood Corner - Mississauga - Each month The Toronto Real Estate Board profiles a neighbourhood and for January of 2006 TREB chose Mississauga!
There were 647 sales in Mississauga this January, a decline of three per cent over the first month of 2007. The average price came in at $339,655, a one per cent increase over the same time-frame last year. Of these sales, 196 were of detached homes which averaged $516,190, up eight per cent over January '07.
Mississauga (MLS districts W12 to W20) had 608 sales in January, up seven per cent over the figure recorded in January of 2005. These sales averaged $305,464, a two per cent increase over last January. Breaking down the total, there were 201 sales of detached homes, which averaged $448,889; there were 171 sales of condominium apartments, and the average for these was $193,481.
There were 569 sales in the Mississauga area during January, down 12 per cent from the figure recorded in January of 2004. The average price, however, rose seven per cent to $298,503. Breaking down the total, detached homes in Mississauga (203 sales) averaged about $418,655, while semis (121 sales) came in at $279,025.
The Mississauga area (W-12 through W-20) registered 645 sales in January, down 10 per cent from the 721 recorded during the same time-frame in 2003. However, the overall average in Mississauga came to $277,594, up seven percent over the $259,207 recorded in January of last year. Average days-on-market was 43, about the same as the Board-wide figure of 42.
In Mississauga (W-12 to W-20) the latter half of this year saw prices climb 10 per cent to $256,824 over the $233,151 recorded for the whole of 2001. Average Days-on-Market in Mississauga was 34, as compared to a city-wide average of 38 days.
Rental Market indicators in the GTA
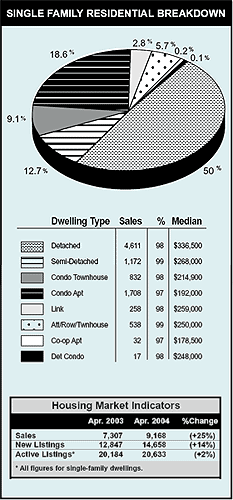
This chart shows the breakdown of single family residential sales
for last month.
Housing Market Indicators |
||||
|
This month |
This month |
% Change |
|
Sales* |
8,084 |
7,329 |
(-9%) |
less sales |
New Listings* |
12,059 |
12,012 |
( -- ) |
equal listings |
Active Listings* |
20,063 |
22,368 |
(+11%) |
more listings all = softer market and prices |
* All figures above for Single-Family Dwellings.
|
February
28, 2008
|
|||
|
Region |
Area Sales |
Average Price |
|
|
East |
391 |
$300,867 |
|
|
West |
627 |
$358,062 |
|
|
Central |
268 |
$504,817 |
|
|
North |
300 |
$419,670 |
|
|
Total |
1,586 |
$380,654 |
|
|
NOTE: Please note these are preliminary figures. Minor adjustments may be required at month's end. |
|||
This is a graphical representation showing the percentage
of homes that sold in each price range.

Excellent, I am ready for an online evaluation
| |
Mississauga MLS Real Estate Properties & MLS.CA Homes for Sale | All Pages including Mississauga Real Estate Blog all maintained by info@mississauga4sale.com Copyright © A. Mark Argentino, P.Eng., Broker, RE/MAX Realty Specialists Inc., Brokerage, Mississauga, Ontario, Canada L5M 7A1 (905) 828-3434 First created - Tuesday, July 16th, 1996 at 3:48:41 PM - Last Update of this website: Thursday, June 1, 2023 6:45 AM
At this Mississauga, (Erin Mills, Churchill Meadows, Sawmill Valley, Credit Mills and or Meadowvale ) Ontario, Canada Real Estate Homes and Property Internet web site you will find relevant information to help you and your family.
Why Subscribe? You will receive valuable Real Estate information on a monthly basis - such as: where to find the 'best' mortgage interest rates, Power of Sale Properties and graphs of current house price trends. Plus, you will pick up ideas, suggestions and excellent real estate advice when you sell or buy your next home.
Read Past Newsletters before you decide |