


| | | | |
The reason that January and February are good months to sell your home or property is because the competition is far lower compared to other times of the year. This means that you may be able to set your asking price at a healthy amount and since there is so little competition, you may find that you receive a good offer under your terms and conditions.
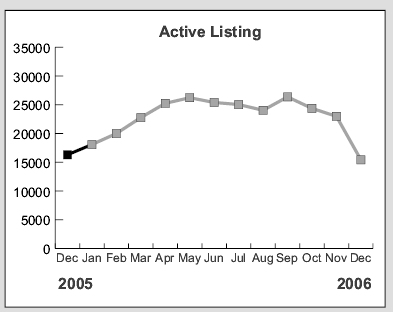
See the graph below showing the number of active listings is at it's lowest amount of the year. Also listings to sales ratios at the chart below and note that the number of listings is down.
Prices are at historic levels, good time to sell, see the graph below
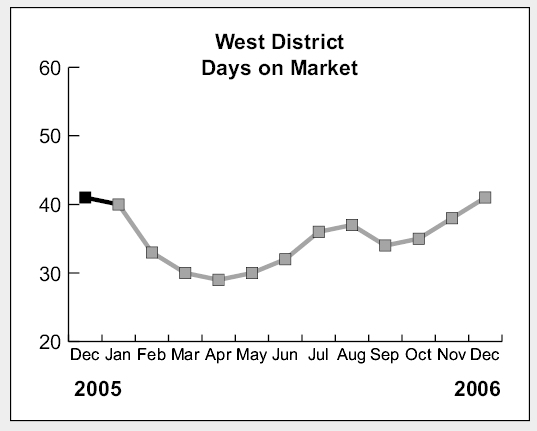
Time on the market is shown on this graph and you will note that in January and February the days on the market plummets, meaning that it's still a good time of year to sell.
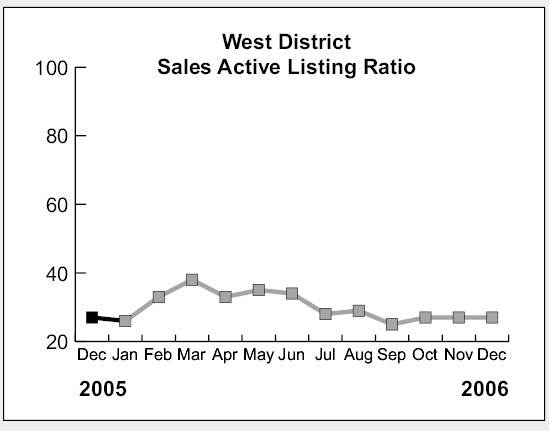
Sales to active listings also increases dramatically in January and February
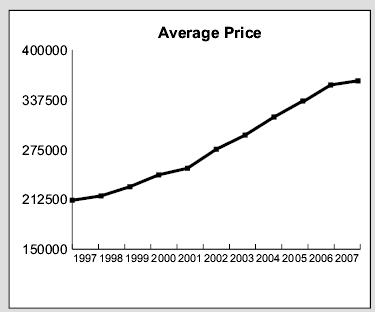
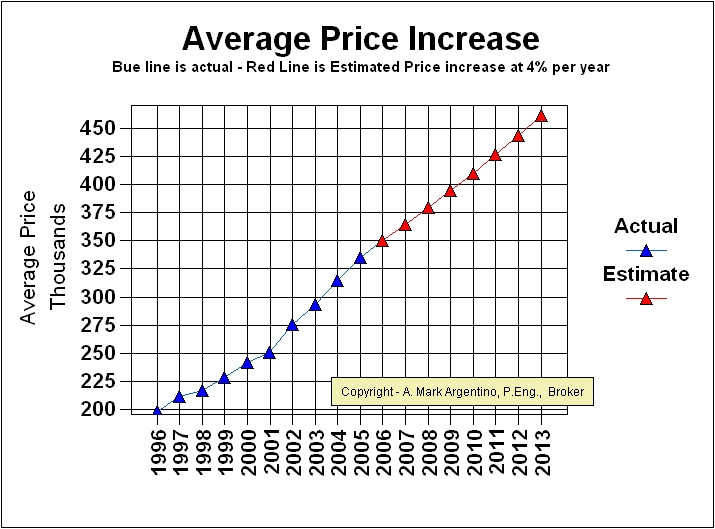
See a graph of the average prices over the past 15 years.
The average single family residential price increased the following amounts in the past few years
Year |
Average % Price Increase |
Average Price |
2006 |
5 |
350,645 |
2005 |
7 |
334,994 |
2004 |
7 |
314,427 |
2003 |
7 |
293,358 |
2002 |
10 |
275,371 |
2001 |
4 |
250,689 |
2000 |
6 |
241,412 |
1999 |
5 |
228,372 |
1998 |
3 |
216,815 |
1997 |
7 |
211,307 |
1996 |
-2 |
198,150 |
The table above shows that prices have increased steadily since 1997, nearly 10 years of unprecedented growth. These figures give an overall trend of the average prices of single family residential prices in the Toronto and GTA marketplace.
Of note is the fact that although the central core prices of real estate have escalated at a much higher rate than the values above. TREB (the Toronto Real Estate Board) has continued it's expansion of MLS boundaries and therefore the average prices above take into account cities and towns that are much further out from the core that have much lower average prices compared to the city core. This shows how great of an impact the high prices in the central city have on the overall price. I don't know exactly how many kilometers of outward growth that TREB experienced over the past 10 years, but I would guess that at least tens of thousands of new properties have been taken into account when calculating the year over year figures.
If prices from 2007 for the next 5 years were to increase at an annual rate of 4% then the average price would be over $460,000 in 2013. The graph below shows this estimated price increase.

See the Average Price Cycles
from January 1995 to Date - a very interesting cyclical pattern is clearly
seen!
See how the historical 1 year mortgage interest rate
compares to the 5 year rate
This information is taken from the TREB (Toronto Real Estate Board) average price figures that are published on a monthly basis for members like myself.
I hope you have enjoyed reading this page.
If you have any
Excellent, I am ready for an online evaluation
| |
Mississauga MLS Real Estate Properties & MLS.CA Homes for Sale | All Pages including Mississauga Real Estate Blog all maintained by info@mississauga4sale.com Copyright © A. Mark Argentino, P.Eng., Broker, RE/MAX Realty Specialists Inc., Brokerage, Mississauga, Ontario, Canada L5M 7A1 (905) 828-3434 First created - Tuesday, July 16th, 1996 at 3:48:41 PM - Last Update of this website: Tuesday, April 9, 2024 7:24 AM
At this Mississauga, (Erin Mills, Churchill Meadows, Sawmill Valley, Credit Mills and or Meadowvale ) Ontario, Canada Real Estate Homes and Property Internet web site you will find relevant information to help you and your family.
Why Subscribe? You will receive valuable Real Estate information on a monthly basis - such as: where to find the 'best' mortgage interest rates, Power of Sale Properties and graphs of current house price trends. Plus, you will pick up ideas, suggestions and excellent real estate advice when you sell or buy your next home.
Read Past Newsletters before you decide |