TOP REAL ESTATE NEWS Hello [NAME]
Real Estate Prices DOWN and Sales Volume DOWN - Mississauga and GTA Real Estate Newsletter January 2024 - Issue 01:08 This months Real Estate Update brings more market news from our real estate market here in Mississauga, Toronto and the GTA. Enjoy and I wish you all the best! Mark
- The average selling price for last month was $1,084,692 (it was $$1,081,736 last month) and this represents a 1.7% increase compared to the same month last year. see graph of prices here
- The average selling price for all home types in 2023 was $1,126,604, representing a 5.4 per cent decline compared to 2022. On a seasonally adjusted monthly basis, the average selling price edged higher, while the MLS® Home Price Index Composite edged lower.
- GTA REALTORS® reported 4,236 sales through TRREBs MLS® System in November 2023 a six per cent decline compared to November 2022.
- There were 65,982 home sales reported through TRREBs MLS® System in 2023 a 12.1 per cent dip compared to 2022. Despite an uptick during the spring and summer, the number of new listings also declined in 2023.
- The MLS® HPI Composite benchmark was down by 1.7 per cent.
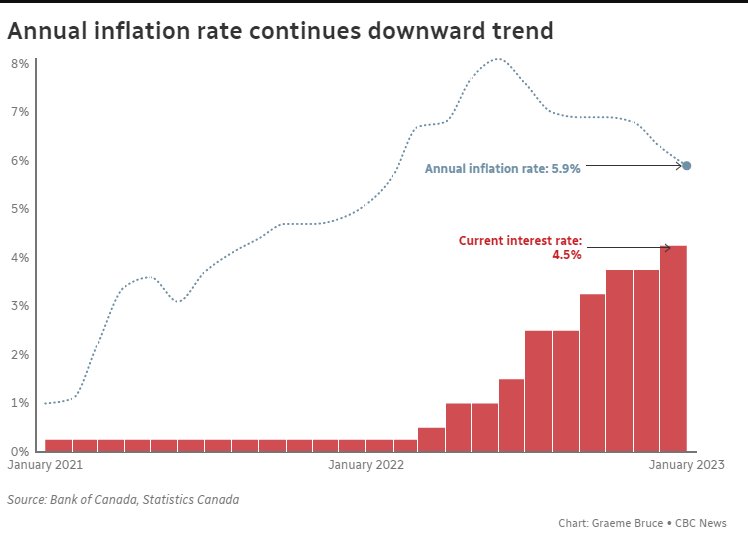
- On Wednesday June 7, 2023 the Bank of Canada raised its policy interest rate to 4.75%. This decision was influenced by several factors including stronger than expected economic data, a thriving job market, and a persistently high inflation rate. In the announcement, the Bank stated that this rate increase reflects their view that monetary policy was not restrictive enough to bring supply and demand back into balance and bring inflation down to the 2% target.
Some economists believe that we may see additional hikes this summer unless there are signs of the Canadian economy cooling off.
- Some history:
During a recent Bank of Canada Rate announcement on Wednesday March 8th 2023 The Bank of Canada held it's benchmark interest rate at 4.5% after 8 consecutive increases. The Bank said it has paused the increases to assess the impact of previous hikes on the economy.
In January 2023 the Bank of Canada raised it's benchmark interest rate to 5.00%
Bank of Canada raises borrowing costs for seventh time in a row amid stubbornly high inflation. The Central bank has been raising rates aggressively to rein in sky-high inflation. Since March of 2022, the central bank has raised its key interest rate six consecutive times, bringing it from 0.25 per cent to 4.50 per cent. The current rate is 5.00%
The Bank Prime rate for most lenders now stands at 7.20%
- read
more about interest rates in Canada
Summary of 2023, 2022 & 2021:
|
The average selling price for all home types in 2023 was $1,126,604, representing a 5.4 per cent decline compared to 2022. On a seasonally adjusted monthly basis, the average selling price edged higher, while the MLS® Home Price Index Composite edged lower.
The average selling price for all properties in 2022 reached a new record of $1,189,850 up 8.6% compared to $1,095,333 in 2021. After reaching a peak in February 2022 the average price dropped almost every month thereafter for the remainder of the year.
The average selling price for all properties in 2021 reached a new record of $1,095,475 up by 17.8 per cent compared to the average of $929,699 in 2020. |
See Graph of Prices
2023 News
Greetings from Fabulous Mississauga!
| 2023 Average Monthly Price |
| December |
1,084,692 |
| November |
1,081,736 |
| October |
1,123,955 |
| September |
1,118,600 |
| August |
1,082,993 |
| July |
1,117,489 |
| June |
1,180,968 |
| May |
1,195,546 |
| April |
1,153,269 |
| March |
1,108,499 |
| February |
1,095,617 |
| January |
1,038,668 |
| |
| 2022 Average Monthly Price |
| December |
1,051,216 |
| November |
1,079,395 |
| October |
1,089,428 |
| September |
1,086,762 |
| August |
1,079,500 |
| July |
1,073,730 |
| June |
1,146,249 |
| May |
1,212,806 |
| April |
1,254,436 |
| March |
1,299,894 |
| February |
1,334,544 |
| January |
1,242,793 |
| |
| 2021 Average Monthly Price |
| December |
1,157,849 |
| November |
1,163,323 |
| October |
1,155,345 |
| September |
1,136,280 |
| August |
1,069,669 |
| July |
1,062,167 |
| June |
1,089,536 |
| May |
1,108,357 |
| April |
1,090,992 |
| March |
1,097,565 |
| February |
1,045,488 |
| January |
839,363 |
| |
see graph of prices here |
|
Latest News Report This is the latest monthly report for TRREB for the average prices and the number of sales in previous month, both were very strong last month. GTA REALTORS® Release Last Month Stats
TRREB RELEASES RESALE MARKET FIGURES AS REPORTED BY GTA REALTORS®
GTA REALTORS Release December and Year-End 2023 Stats
TORONTO, ONTARIO, January 4, 2024 While the overall demand for housing remained buoyed by record immigration in 2023, more of this demand was pointed at the rental market. The number of Greater Toronto Area (GTA) home sales in 2023 came in at less than 70,000 due to affordability issues brought about by high mortgage rates.
High borrowing costs coupled with unrealistic federal mortgage qualification standards resulted in an unaffordable home ownership market for many households in 2023. With that said, relief seems to be on the horizon. Borrowing costs are expected to trend lower in 2024. Lower mortgage rates coupled with a relatively resilient economy should see a rebound in home sales this year, said new Toronto Regional Real Estate Board (TRREB) President Jennifer Pearce.
There were 65,982 home sales reported through TRREBs MLS® System in 2023 a 12.1 per cent dip compared to 2022. Despite an uptick during the spring and summer, the number of new listings also declined in 2023.
The trend for listings has been largely flat-to-down over the past decade, which is problematic in the face of a steadily growing population. On a seasonally adjusted monthly basis, sales increased compared to November, while new listings declined for the third straight month.
The average selling price for all home types in 2023 was $1,126,604, representing a 5.4 per cent decline compared to 2022. On a seasonally adjusted monthly basis, the average selling price edged higher, while the MLS® Home Price Index Composite edged lower.
Buyers who were active in the market benefitted from more choice throughout 2023. This allowed many of these buyers to negotiate lower selling prices, alleviating some of the impact of higher borrowing costs. Assuming borrowing costs trend lower this year, look for tighter market conditions to prompt renewed price growth in the months ahead, said TRREB Chief Market Analyst Jason Mercer.
Record immigration into the GTA in the coming years will require a corresponding increase in the number of homes available to rent or purchase. People need to have comfort in knowing that they can plan their lives and future with the certainty that they will have the stability of an affordable place to live, said TRREB CEO John DiMichele.
All the Best! Mark PS: You may [CONTACT] to download my vCard and add us to your address book. The statistics for last month are out, the figures for previous month are out and average GTA sale price and volumes continue to be at or near all time highs, see this page for latest market stats and results from the previous month Mortgage Interest Rates - time to lock in? read more 2023 UPDATE and LOOKBACK
The average selling price for all home types in 2023 was $1,126,604, representing a 5.4 per cent decline compared to 2022. On a seasonally adjusted monthly basis, the average selling price edged higher, while the MLS® Home Price Index Composite edged lower.
The average selling price for all properties in 2022 reached a new record of $1,189,850 up 8.6% compared to $1,095,333 in 2021. After reaching a peak in February 2022 the average price dropped almost every month thereafter for the remainder of the year.
The average selling price for all properties in 2021 reached a new record of $1,095,475 up by 17.8 per cent compared to the average of $929,699 in 2020.
Average selling price for 2020 was $929,699 – up by 13.5% compared to $819,319 in 2019
Average selling price for 2019 was $819,319 – up by four per cent compared to $787,856 in 2018
The average selling price for 2018 was $787,185 – down 4.5 per cent compared to 2017 The average selling price for 2017 was $822,681 – up 12.7 per cent compared to 2016 The average selling price for 2016 was $729,922 – up 17.3 per cent compared to 2015 The average selling price for 2015 was $622,217 up 9.8 per cent from 2014 Average selling price for 2014 was $566,726 and for 2013 was $523,036, which represented an increase of 8.4% compared to 2013 and a 5.2 per cent compared to the calendar year 2012 average of $497,130 - see graph of prices here | | | See seasonal fluctuations in average prices See the full report from TRREB below. 
INTEREST RATES
| Today's Mortgage Rates | | Term | Rate | | 1 Yr closed |
7.04% | | 2 Yr closed |
5.99% Special
| | 3 Yr closed |
6.21%
(sale) | | 4 Yr closed |
6.14%
(sale) | | 5 Yr closed |
5.39%
(sale) | | 5 Yr Variable |
7.0%
(prime minus 0.2%) |
5 Yr Open
Variable (+3.3%) |
9.78% |
Current Bank of
Canada Prime Rate |
5.00%
|
Current Bank
Consumer
Lending
Prime Rate |
7.20%
|
| See Best Rates |
NOTE: You can often negotiate a discount of 0.3 - 0.5% or more off posted rates.
"Best" Mortgage Rates BANK PRIME RATE As of
January 8, 2024
the Bank Prime Rate was 7.20%
, read more
The Bank of Canada Prime Rate is currently 5.00%
and the current Prime Lending Rate is 7.20%
The Bank prime rate is typically about 2% higher than the overnight rate, but for the past few years the banks are not passing along this entire amount and this is why the current bank lending rate to their prime to customers is 7.20%
The major banks in Canada typically charge their best customers 2% to 2.2% above the Bank of Canada Prime Rate. Today, it's 2.20% above prime, which means that the Bank Prime or Prime Rate that we see is now 7.20%
Bank Prime Rate means "best" and this is the rate that banks charge their absolute best customers for loans, which is usually only other lending institutions. Changes in the Bank of Canada prime rate influence changes in other interest rates, including variable interest rate mortgages. This "bank rate" rate fluctuates based on economic conditions. Some mortgage companies offer interest rates starting at Prime minus .1% (or more) as an incentive to borrow from them! These are known as "SUB PRIME" Mortgages. One of the dangers with sub-prime mortgages is when they come due too early in the mortgage term and rates have increased, it's difficult to make the change to much larger payments. Read more about Sub-Prime Mortgages For example, see the
Royal Bank Prime Rates
Bank of Canada Prime rates found here Please refer to this page to see a graph of Average prices and More House Prices in 2023!
Click the image below to see more details and graphs of home prices in the GTA

| POWER OF SALES | | | |
|