


| | | | |
| ||
Report on last months NewsGTA Resale Housing Sales Up |
||
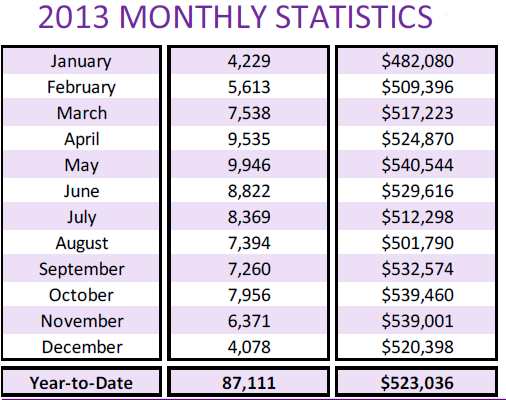
Year over Year summary Table (to date)
|
In this Issue of my newsletter
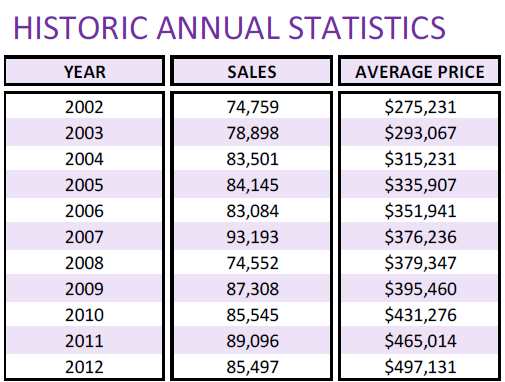
This chart below shows the historical annual price and sales volumes since 2002 to 2014:

This is the report for latest month in real estate sales
from the Toronto real estate board and indicates a 'normal' amount of activity
and price levels.
Below is the latest release of figures
Below is the report from TREB for the January 2014 Residential Real Estate Market in the GTA
See more at this page about average prices and read the press release below.
Thanks!
Mark
TorontoMLS Sales Up in February
TORONTO, March 5, 2014 – Toronto Real Estate Board President Dianne Usherannounced that February 2014 home sales reported by Greater Toronto Area REALTORS® were up by 2.1 per cent compared to the same period last year.
Total February sales amounted to 5,731 compared to 5,613 last year.
“Despite the continuation of inclement weather in February, we did see a moderate uptick in sales activity last month. The sales increase was largely driven by resale condominium apartments.
New listings of resale condominium apartments were up on a year-over-year basis, giving buyers ample choice. This is in contrast to the listings situation for singles, semis and townhomes, where supply continued to be constrained.
Some would-be buyers had difficulty finding a home that met their needs,” said Ms.Usher.
“If we see renewed growth in listings for low-rise home types, the pace of sales growth will accelerate as we move through the year,” Ms. Usher continued.
The average selling price for February 2014 sales was up by 8.6 per cent to $553,193, compared to the average of $509,396 reported for February 2013. The MLS® Home Price Index (HPI) Composite Benchmark was up by 7.3 per cent year-over-year.
“While the strong price growth experienced over the last year should prompt an improvement in the supply of listings, sellers’ market conditions will continue to prevail this year.
Home prices, on average, will trend upwards at a pace well-above the rate of inflation. The impact of strong price growth on affordability will be mitigated by low borrowing costs,” said Jason Mercer, TREB’s Senior Manager of Market Analysis.
Greater Toronto REALTORS® are passionate about their work. They are governed by a strict Code of Ethics and share a state-of-the-art Multiple Listing Service. Over 36,000 TREB Members serve consumers in the Greater Toronto Area. The Toronto Real Estate Board is Canada’s largest real estate board.
All the Best!
Mark
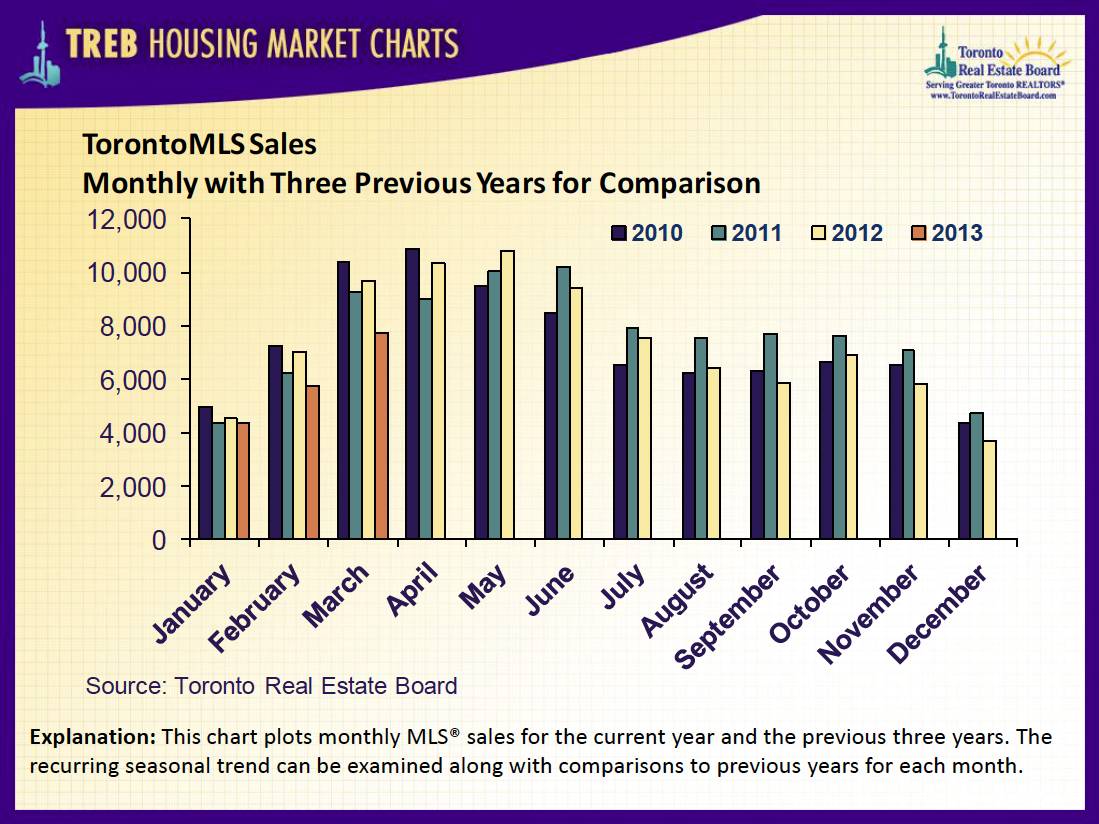
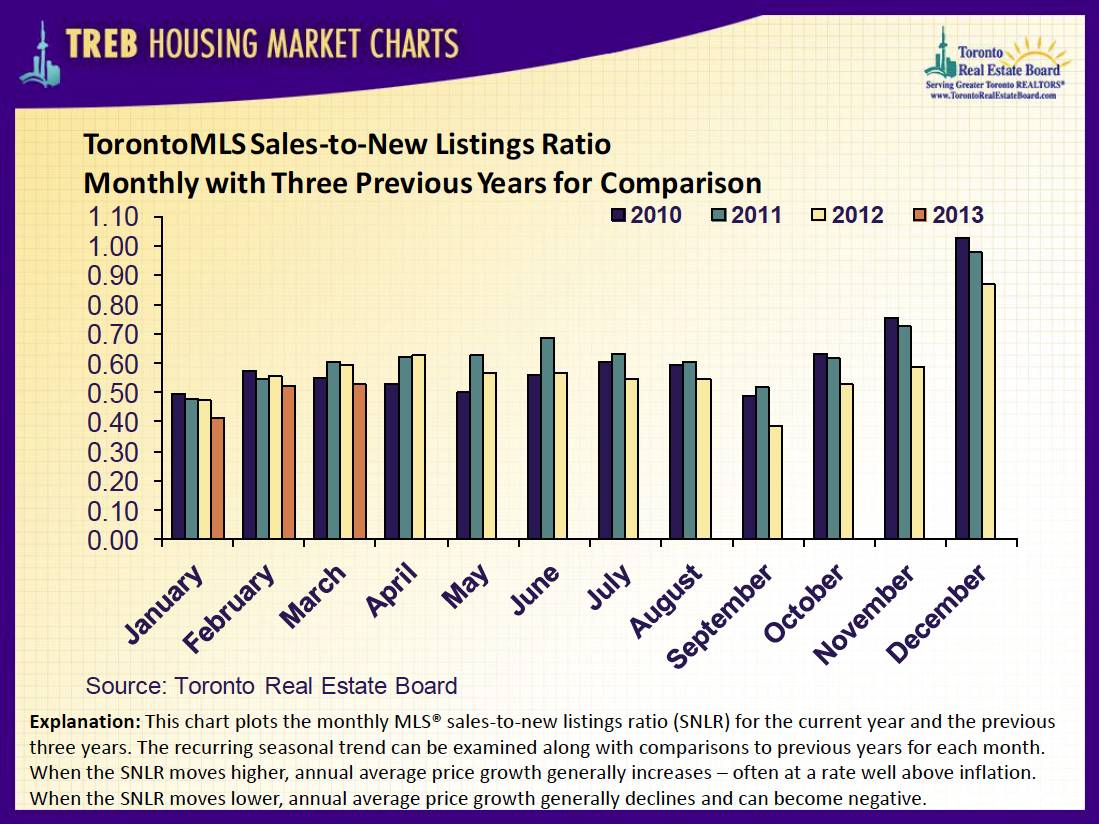
This chart plots the monthly MLS sales for the current year and the previous three years. The recurring seasonal trend can be examined along with comparisons to previous years for each month. Click the chart bellow to see a larger printable version.
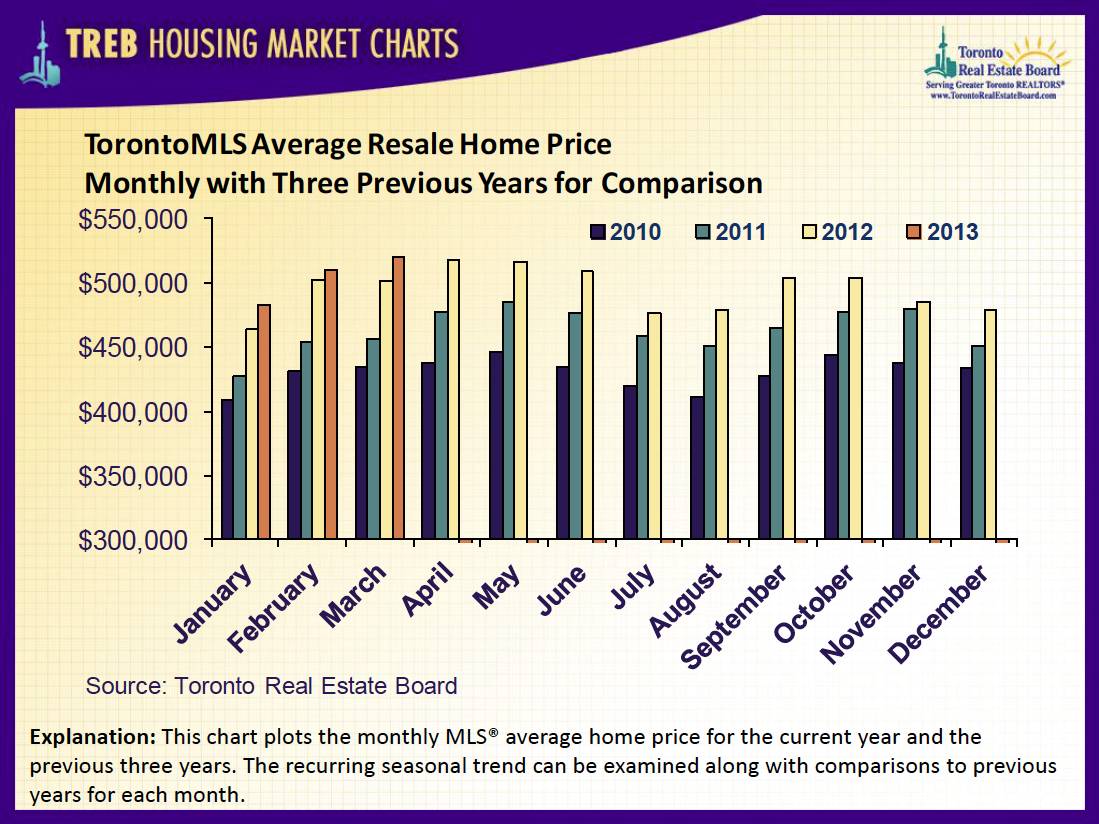
This chart plots the monthly MLS average home price for the current year and the previous three years. The recurring seasonal trend can be seen along with comparisons to previous years for each month. You can click the thumbnail below to see a larger printable version. As well, you can see the season trends in graphical form
I hope this finds you Happy and Healthy!
All the Best!
Mark
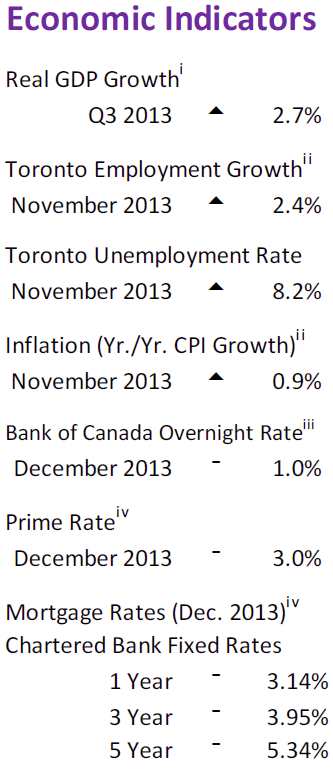
Housing market indicators from last month
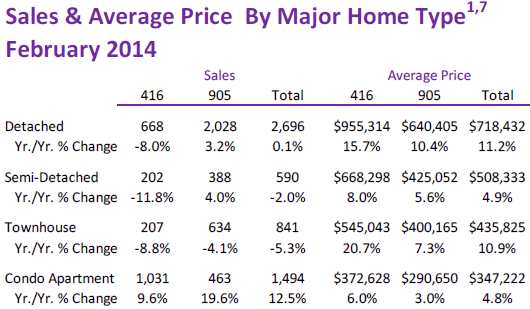
SUMMARY OF SALES AND AVERAGE PRICE click for larger image
Toronto
REALTORS® are passionate about their work. They adhere to a strict code of ethics and share a state-of-the-art Multiple Listing Service designed exclusively for REALTORS®.
Serving more than 24,000 Members in the Greater
Toronto Area, the Toronto Real Estate Board is Canada's
largest real estate board. Greater Toronto Area
open house listings are now available on www.TorontoRealEstateBoard.com.
Summary of TorontoMLS Sales and Average Price
Sales by housing type

See the Average Price Cycles
from January 1995 to Date - a very interesting cyclical pattern is clearly
seen!
See how the historical 1 year mortgage interest rate
compares to the 5 year rate
Update: The figures are in for 2012 and the average price was $479,000, I've updated the graph below to reflect these changes....stay tuned!


Breaking down the total Numbers into TREB Areas for this month
Please browse here if you wish to see all the TREB Sales stats for 2007
This graph shows the 1989 real estate recession in the GTA and how long it took to recover from the drop in the average price from the peak price in February of 1989 to 2002

Statistics Canada, Quarter-over-quarter growth, annualized
Statistics Canada, Year-over-year growth for the most recently reported month
Bank of Canada, Rate from most recent
Bank of Canada announcement
Bank of Canada, Rates for most recently completed month
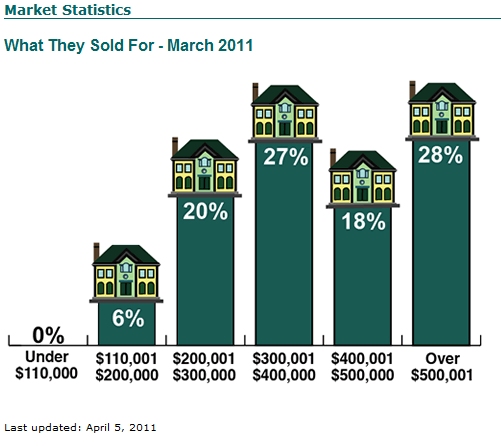
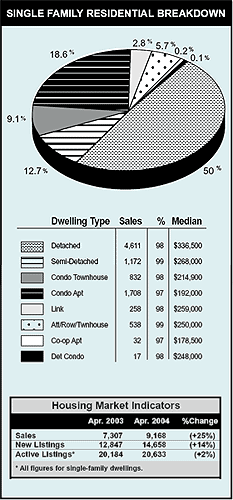
This is a graphical representation showing the percentage of homes that sold in each price range.
Note the shift when you compare this month to 2 years ago,
quite significant!
What different properties sold for in March of 2011
 August
2010
August
2010
August of 2008
January 2011
December
10, 2013 |
|||
Region |
Area Sales |
Av. Price |
|
East |
123 |
$278,453 |
|
West |
221 |
$323,384 |
|
Central |
88 |
$432,270 |
|
North |
93 |
$375,131 |
|
Total |
525 |
$340,275 |
|
NOTE: Please note these are preliminary figures. Minor adjustments may be required at month's end. |
|||
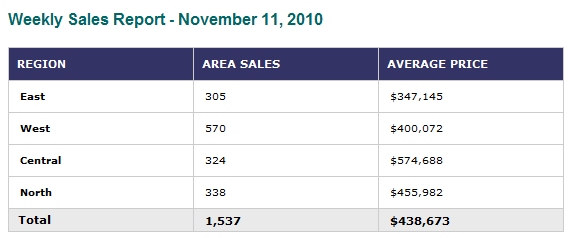
Latest sales report for November 2010
latest Sales Report - August 26, 2010
| RegION |
Area
Sales |
Average
Price |
|---|---|---|
East |
329 |
$327,637 |
West |
555 | $392,685 |
Central |
266 |
$454,598 |
North |
337 |
$475,755 |
Total |
1,487 |
$408,194 |
NOTE: Please note these are preliminary figures. Minor adjustments may be required at month's end.
For comparison purposes, see last year in February below.
February
28, 2008 |
|||
Region |
Area Sales |
Average Price |
|
East |
391 |
$300,867 |
|
West |
627 |
$358,062 |
|
Central |
268 |
$504,817 |
|
North |
300 |
$419,670 |
|
Total |
1,586 |
$380,654 |
|
NOTE: Please note these are preliminary figures. Minor adjustments may be required at month's end. |
|||
* All figures above for Single-Family Dwellings.
Historic Sales Figures
Neighbourhood Corner - Mississauga - Each month The Toronto Real Estate Board profiles a neighbourhood and you may read how the market
There were 647 sales in Mississauga this January, a decline of three per cent over the first month of 2007. The average price came in at $339,655, a one per cent increase over the same time-frame last year. Of these sales, 196 were of detached homes which averaged $516,190, up eight per cent over January '07.
Mississauga (MLS districts W12 to W20) had 608 sales in January, up seven per cent over the figure recorded in January of 2005. These sales averaged $305,464, a two per cent increase over last January. Breaking down the total, there were 201 sales of detached homes, which averaged $448,889; there were 171 sales of condominium apartments, and the average for these was $193,481.
There were 569 sales in the Mississauga area during January, down 12 per cent from the figure recorded in January of 2004. The average price, however, rose seven per cent to $298,503. Breaking down the total, detached homes in Mississauga (203 sales) averaged about $418,655, while semis (121 sales) came in at $279,025.
The Mississauga area (W-12 through W-20) registered 645 sales in January, down 10 per cent from the 721 recorded during the same time-frame in 2003. However, the overall average in Mississauga came to $277,594, up seven percent over the $259,207 recorded in January of last year. Average days-on-market was 43, about the same as the Board-wide figure of 42.
In Mississauga (W-12 to W-20) the latter half of this year saw prices climb 10 per cent to $256,824 over the $233,151 recorded for the whole of 2001. Average Days-on-Market in Mississauga was 34, as compared to a city-wide average of 38 days.
Rental Market indicators in the GTA
This chart shows the breakdown of single family residential sales
for last month.

Excellent, I am ready for an online evaluation
| |
Mississauga MLS Real Estate Properties & MLS.CA Homes for Sale | All Pages including Mississauga Real Estate Blog all maintained by info@mississauga4sale.com Copyright © A. Mark Argentino, P.Eng., Broker, RE/MAX Realty Specialists Inc., Brokerage, Mississauga, Ontario, Canada L5M 7A1 (905) 828-3434 First created - Tuesday, July 16th, 1996 at 3:48:41 PM - Last Update of this website: Thursday, June 1, 2023 6:45 AM
At this Mississauga, (Erin Mills, Churchill Meadows, Sawmill Valley, Credit Mills and or Meadowvale ) Ontario, Canada Real Estate Homes and Property Internet web site you will find relevant information to help you and your family.
Why Subscribe? You will receive valuable Real Estate information on a monthly basis - such as: where to find the 'best' mortgage interest rates, Power of Sale Properties and graphs of current house price trends. Plus, you will pick up ideas, suggestions and excellent real estate advice when you sell or buy your next home.
Read Past Newsletters before you decide |