| | | | |
The purpose of this paper is to attempt to give some insight as to how the housing market operates in respect to the economy and in particular the business cycle. This paper will examine the two entities and attempt to explain whether or not one directly or indirectly has an effect on the other, and if such a relationship is found to be in existence this paper will explain how this relationship works.
To begin, business cycles are defined and how they affect the economy is explained. Following that discussion comes an introduction to housing markets in general across the country, with some reference to a specific market, that of the City of Toronto.
After establishing the impact of housing markets on an economy, this paper shifts its focus to try and form a relationship between housing markets and business cycles. Lastly, there is a brief discussion on the future of housing markets in relation to the business cycle and current economic conditions. This paper was written by Myles Bickram and I have reproduced it here for you to read and enjoy.
The current global economy is in turmoil. Businesses are closing at incredible rates. Jobs are being lost in enormous volume. Corporations thought to be staples in the financial industry are crumbling. It is astonishing to see just how far the global economy has fallen in the past two years. Even more astounding is the current state of local economies. It is hard to imagine countries like the United States and Canada are in any sort of peril as it has not been seen since the Great Depression of 1929. That is nearly 80 years of being heralded for economic stability just to have it all come to a halt. Of course, both countries have experienced their own ups and downs, whether it is a recessionary period like that of the early 1990’s or simple trough periods during the business cycle. What is interesting about the current “recession” is how it has affected other markets, particularly the housing market.
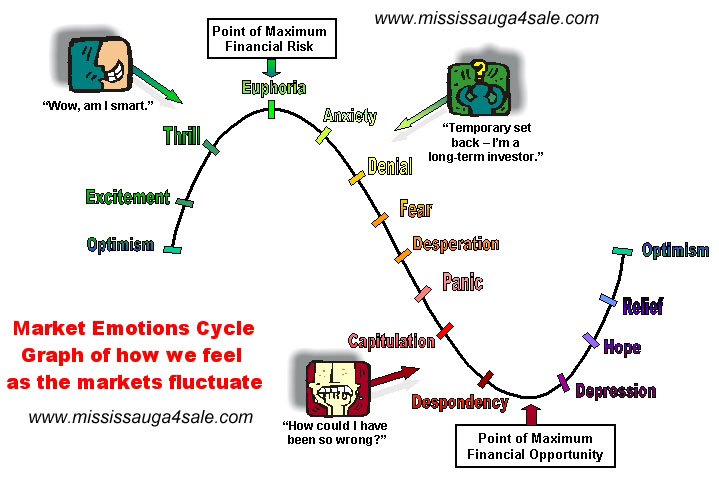
Real estate is thought to be a sound investment. The stock market is volatile and is full of ups and downs. These extremes occur not only in the long term, but quite often on a daily basis. The real estate market on the other hand is thought to be more stable, not relying on short term swings in market conditions but instead on long term investment and capital growth.
Everyone has heard the old saying which is quite often taken as free advice, invest in real estate, and the adage makes sense. A person buys a house for $200,000 and makes their mortgage payments on time every month for the next 20 years. Now when looking to sell their home the value has increased to $350,000. That is $150,000 over what the person paid, plus they received 20 years of benefit from the home with the benefits of a home. A market like this must then have a major influence on the national economy.
On an even smaller scope the real estate market has a large impact on local economies. But then what about the current economic turmoil? How does the current state of the economy affect the housing market? Taking a step back, how do current economic conditions in general influence the housing market of the same time period?
|
Before diving into the housing prices and how they change it is probably beneficial to explain exactly what a recession is and how it relates to the economy and then focus specifically on the housing market. The standard definition of a recession is that it is characterized by two successive three month periods of negative economic growth[1]. Individual countries however have taken this basic definition and altered it into their own interpretation. Take for example the National Bureau of Economic Research (NBER) in the United States, whose definition of a recession becomes very specific, define a recession as a significant decline in economic activity spread across the economy, lasting more than a few months, normally visible in production, employment, real income, and other indicators[2].
For the purpose of this paper however, the definition that will be referenced to will be that of Canadian Government, in that a recession refers to a significant drop in economic activity, lasting more than a few months, as measured by employment rate and real gross domestic product (GDP)[3]. As stated above, it becomes evident that separate locales and institutions create their own definition of a recession for no other reason than to suit their own needs. In any case, back to the subject at hand.
Now, a recession is not a new phenomenon. In fact, it has come about in the past multiple times. The reason for this is because a recession is part of the business cycle. In the most basic form a business cycle illustrates the state of the economy as a measurement of growth over time for a certain length of time before repeating itself. This cyclical behaviour can be traced back to 1854[4].
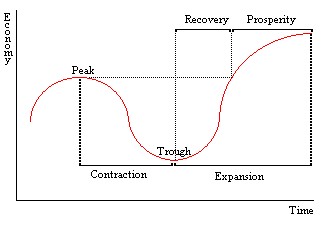
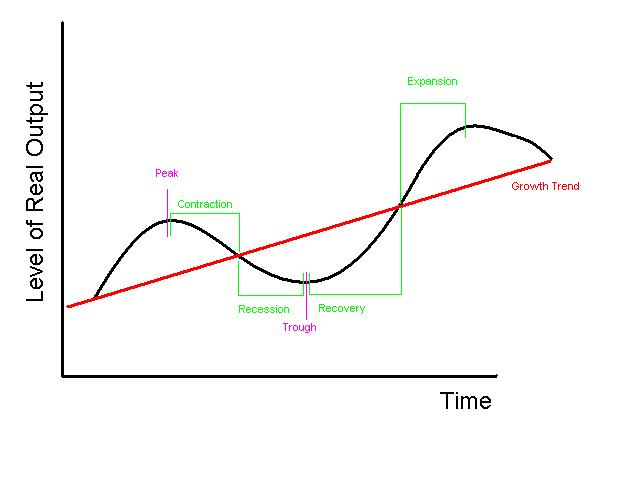
For those who are unfamiliar with a business cycle it is quite a simple concept to understand. In a business cycle there are two key points in time that are looked at, peaks and troughs. A peak in a business cycle, also called a boom, occurs when an economy is at its highest level of total real output. A trough on the other hand is simply the opposite, when the economy is at its lowest level. Encompassed in a business cycle also comes 4 transition periods: a contraction, a recession, a recovery and an expansion.
These 4 periods are quite often grouped to explain upward and downward movements and are called expansions and recessions, but this paper will remain with a more detailed explanation. A contraction begins after the economy reaches its peak and begins its “cooling off” period and real output begins to decline. Taking the points on this graph and drawing a line of best fit creates a representation of the economy’s growth trend. When that contraction declines and real GDP falls beneath the growth trend line the economy enters a recession until it reaches a trough.
This occurs when the economy begins to turn around and pick itself back up, causing the business cycle to enter a recovery phase. Lastly, when the output level ascends above the growth trend the economy is said to be in an expansionary phase. Of course this is a very simplified explanation of what a business cycle represents and there are volumes that can be written on the matter. However these volumes can become quite confusing when trying to link all the different theories and explanations together, so for the sake of this paper the explanation given will suffice. A graphical representation can be seen in Graph 1 of Appendix A.
Typically a business cycle repeats itself over a time span ranging from as long as 7 years to as short as 3½ years[5]. The NBER has documented that on average from 1854 to 2001 business cycles have lasted for 56 months from peak to previous peak[6] in the United States. Furthermore, growth trends, like that of Canada and the US, tend to slope upward over time. While the cycle does repeat itself time and time again, the peaks tend to reach higher levels as time moves forward. This is where the link between housing prices and the business cycle begins to manifest.
![]() As mentioned earlier, it is a common belief that housing prices rise over time so one of the best investments a person can make is to buy real estate. This theory, much like the business cycle, tends to repeat itself in the housing market, nicknamed the “bubble”. However the term bubble is not exclusive to housing markets, but rather a term for investments in general.
As mentioned earlier, it is a common belief that housing prices rise over time so one of the best investments a person can make is to buy real estate. This theory, much like the business cycle, tends to repeat itself in the housing market, nicknamed the “bubble”. However the term bubble is not exclusive to housing markets, but rather a term for investments in general.
The notion behind it is simple, enter a market when the bubble is small and prices are low and sell when the bubble expands and prices rise, but do so before the bubble bursts and the returns plummet. In essence it is just another term for buy low, sell high. How then does this relate to business cycles? The answer is not so farfetched.
Business Cycles and Housing Markets: Any Correlation?
Much like the business cycle, housing prices tend to follow a trend. Also, much like business cycles, these housing trends, or bubbles, periodically repeat themselves. That may be why when housing prices fall so many people remain optimistic. Their rationale then shifts from making a substantial gain now to having to wait a little while to make those gains in the future, when the bubble gets larger and markets are once again prosperous. Now these trends should not be overlooked, as they have been shaping up for years.
As early as the mid 1960’s this trend became evident. Over the course of a five year period from 1966 to 1971 the average price of a home in Canada rose from $17,552 to $24,607. That is an increase of $7,055 in five years. This increase was also felt on a provincial scale. Ontario for example, experienced an increase over the same five years of $8,060, from $19,194 to $27,254. The City of Toronto also saw an increase in housing prices over this period. In 1966 the average price of a house in Toronto was $21,950. By 1971 that price had increased to $31,822. That translates to an increase of 45%.
In today’s market an increase like that is what investors dream about. There was in fact only one city according to a report released by Toronto Real Estate Board. Ironically enough it was Montreal, but the decrease from 1966 to 1971 totaled an insignificant -.5%. Every other city contributing to the report experienced substantial gains[7].
Conversely, the North American economy began to feel the effects of a mild recession entering into the 1970’s, specifically in 1973 due to the energy and oil crisis. It has actually become so bad that by December of 1974 the Dow had reached a low of 577 points[8]. Of course, when looking at the overall trend of the business cycle, we see that there is a definite tendency for GDP to increase, creating an upward sloping trend line. This trend can also be applied to the housing market and its prices.
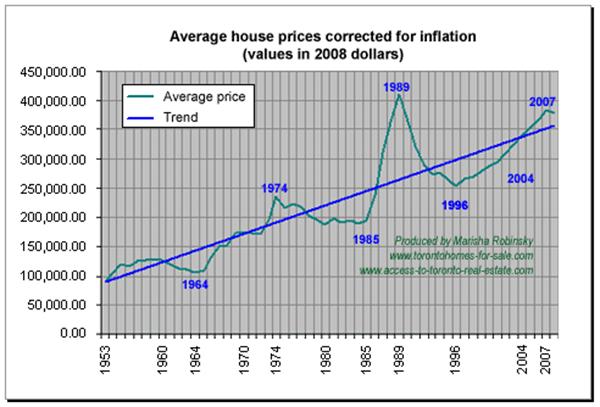
In a report shown in Graph 1 it is noted that housing prices since 1954 have been on a steady incline[9], which can be seen in Graph 1 of Appendix B. However this trend only acts as a line of best fit, therefore just like the business cycle, there are significant fluctuations that affect the slope of this trend line. Without these fluctuations the price of housing in any market would simply skyrocket to unimaginable heights.
One important thing to remember is that the housing market behaves is a manner that is similar to any other type of commodity market where scarcity of available resources plays a role in the pricing of the goods for sale. However, housing prices do not rely solely on the worth and application of resources allocated. Housing utilizes specific elements that can be unique to a specific home. Land for instance is unique to every house available on the market, as land is unique and cannot be replicated. Houses also yield varying prices due to their value as a social good[10]. A prime example of this can be found in the mid 1970’s.
In the same report shown in Graph 2 below it can be seen that in 1974 the average price of a house was at a definite high for the decade. As shown in Graph 2 of Appendix B the previous few years exhibited considerable growth in pricing. A substantial cause for this increase in pricing was a sudden increase in the demand for housing. This increase in demand came from two sources.
The first was a recovery made by the economy as it tried to rally itself out of the energy and oil crisis. The second and probably more important reason was an increase in the need for housing. The 1970’s was a period in which there was a significant increase in immigration from abroad. That coinciding with the fact that housing cannot be instantly created drove significantly affected the price of housing 1970’s and into the 1980’s[11]. This is where it becomes clear that housing derives much of its value from being, among other things, a social good.
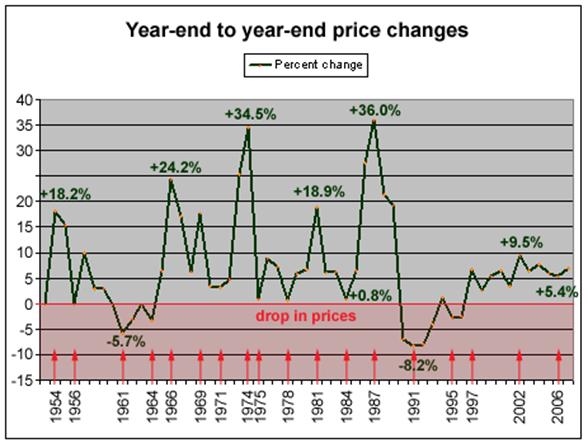
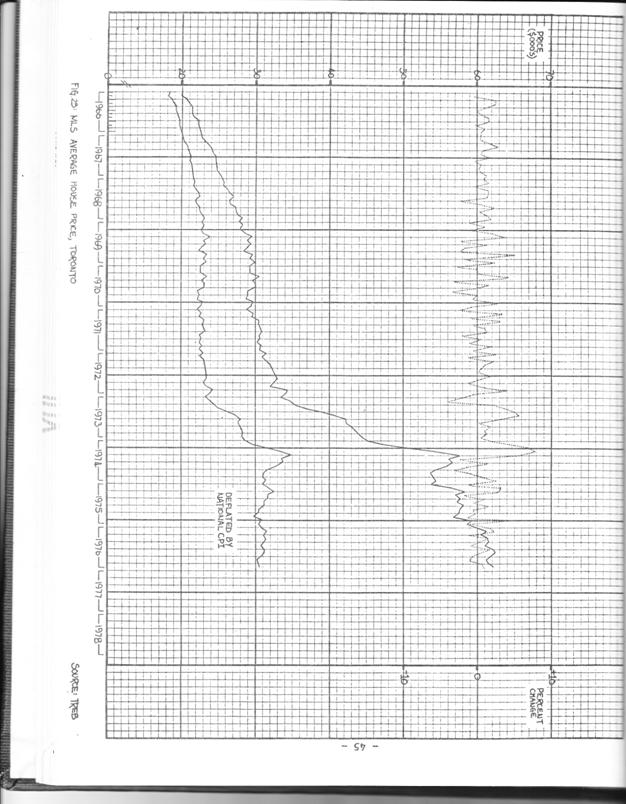
 It is however interesting to note that Toronto was more than likely the first city in Canada that experienced such swift increases in housing prices[12]. One element thought to be a reason for these increases was inflation rate in the national economy. These expectations of increasing prices caused a rapid and panicked number of transactions in the residential property market in the mid 1970’s, further increasing the average price of a house in Toronto. However, with the introduction of the Land Transfer Tax in April of 1974 came a stabilization of housing prices opposed to sporadic changes[13]. This is not to say however that prices did not continue to rise. As can been seen in Graph 3 of Appendix B, even though the tax did help to slow down the rapidly increasing prices prior to 1974, housing prices did continue to rise at a steady pace. However, when deflated by the national consumer price index (CPI), housing prices actually began to decrease ever so slightly over the same time period[14]. Moving forward to the late 1970’s and 1980’s it becomes clear that housing prices were driven to increase further. From 1977 to 1987 housing prices saw an increase of nearly 36%. The price of ownership had also increased by 46%, as well as rental costs, which had risen by nearly 31%[15]. How does this then relate to the business cycle?
When a growth trend line is plotted against the peaks and trough of a business cycle typically the trend revealed is that the GDP of an economy over time will slope upwards. Of course, this is a general statement that can only be proven from historical performance. As it is not possible to predict far enough into the future whether or not that trend will change, therefore one can assume that the same variables that have caused a positive slope in the trend line to date will continue to do so in the future.
Taking that notion and applying it to past business cycles, that theory of ever increasing levels of GDP holds true. Referring to Graph 4 in Appendix B it becomes clear that this has been the case for Canada for years. However, it is important to remember that this trend is something that comes from long term analysis, not short term. It is also important to make it clear that the growth trend of the GDP is not positively related to the prices of houses, yet housing prices seem to reflect current economic performance. The reason why this is true is because of what the GDP consists of. While real estate is a definite component to the GDP, the GDP takes into account all goods and services that make up an economy, which means that while one sector may suffer, a multitude of others may prosper. This is why the GDP shows such an extended growth trend, while housing prices can rise and fall significantly, as was the case in the late 1980’s entering into the 1990’s.
By the end of the 1980’s the North American economy had begun the recession of the 1990’s. This is one of the few occasions where a significant fall in the GDP trend is evident. This fall however is rather miniscule when compared in relation to the crash of housing markets. Referring back to Graph 2 of Appendix B one can see that by 1989 housing prices in Canada had reached a 50 year and all time high. Incredibly by 1991 the average price of a house in Canada had reached a 50 year low.
This sudden decrease in prices falls in line with the beginning of the 1990’s recession, as can be seen when referring back to Graph 4 of Appendix B. However as stated before this does not mean that housing prices directly affect the GDP. It may have an impact, but not of that amplitude. What is true is that the GDP does in fact have a significant impact on housing.
With a very basic analytical tool this relationship between the GDP and its effect on housing can be illustrated. First one must take note of the last peak in GDP before the recession of the 90’s. By simply drawing a straight line from the Y axis on Graph 4 that is tangent to that peak and parallel to the X axis one should be able to see where this line intersects with the GDP, in the year 1996. Taking that year into account and then looking back to Graph 1 a definite relation can be seen. As the GDP began to rise in 1996, so did housing prices, a relationship that has been seen before.
In their book Housing Prices and the Macroeconomy: Implications for Banking and Price Stability authors Charles Goodheart and Boris Hofmann state that there exists a definite correlation between economic performance and housing prices[16]. However their analysis can lead to the assumption that housing prices and the business cycle are in a two way relationship, which is not the case. While it may be true on a macroeconomic scale, which typically implies long run analysis, the business cycle and its fluctuations are not as sensitive to housing prices as housing prices are sensitive to changes in the business cycle. They are however correct in that significant changes or turning points in one element has reflect a change in the other.
Evidence of this comes from as recent as 2001 and the bursting of the stock market bubble. As funds were taken out of the stock market the economy began to reach a contraction point. These funds however instead of being hoarded by the public were then reinvested into goods and commodities, like those found in the housing market[17]. This is where a distinction can be made in how housing prices are determined. It is not entirely reliant on how well an economy is performing, but instead on the demand created for housing and money willing to be invested into it[18]. However, housing prices are still volatile and fluctuate regardless of the amount of investment pumped into the market.
Similar to the business cycle, housing markets tend to repeat themselves, as has been the case in recent years. Also, in line with the business cycle, housing markets exhibit long term growth. The manner in which they do so however is a much bumpier ride. Referring back to Graph 1 of Appendix A the business cycle is explained and the stages of the business cycle become clear. Maintaining such a steady growth pattern over time, like that shown in Graph 4 of Appendix B, is done so by very close monitoring and control of interest rates by central banks.
Housing markets on the other hand are subject to less control and therefore exhibit many peaks and valleys over the same time as a business cycle. For simplicity’s sake one can assume a business cycle to last for 48 months[19]. Using that time frame and referring to Graph 5 of Appendix B it becomes clear just how volatile the housing market is. Supplied by Mark Argentino, a real estate broker in the Greater Toronto Area, the graph shows that markets in any given area, or in this specific case Toronto, are subject to a rollercoaster ride of prices[20].
For instance take the year 2001. As seen in Graph 4 of Appendix B, following somewhat stagnant growth from 2000 to 2001, from 2001 onward Canada’s GDP has been rising steadily. Referring to Graph 5 of Appendix B it can be seen that the housing market in Toronto experienced rather significant growth from 2000 to 2001 before steadying off to follow a growth trend that nearly mirrors that of the GDP. However, Graph 5 also shows that even though the price of a house is on a steady rise, the price does fall quite often.
In fact, the price of housing rises and falls so much that it begins to form its own pattern, as can be seen when following Graph 5 from 2001 onward. If that graph were to be transformed into a graph recording business cycles the result can be formed that every year the housing market completes a cycle[21]. Reference was made at the beginning of this paper to the stock market being volatile while housing markets are said be sound and steady, however analysis of Graph 5 seems to prove other wise
Now it has been illustrated throughout this paper how the business cycle affects housing prices. It has also tried to shed light on how the housing market is independent from the business cycle. What has not been touched upon yet is what will happen in the coming years as the economy tries to pull through these tough times. This of course requires some extrapolation, and for the cynics a little bit of wishful thinking.
First, it is important to understand that Canada has not been as severely affected by the current economic downturn as the United States. For years the two economies have been thought of as very closely related to each other. In the past few years however Canada and the United States have begun to part ways, as is the case with the business cycle and housing markets[22].
In the coming years it is unclear how far the two will separate, and while the extrapolation can be done, it is hard to imagine whether or not the results will be accurate. However, following the trend of the housing market, it is safe to make the assumption prices will in the long run increase, and so long as the output of the economy does not crash like it did in the 1930’s and 1990’s, this assumption is more than likely to become a reality.
According to Mark Argentino, if current market trends continue, the average price of a home in Toronto lands somewhere in the neighbourhood of $476,000. Over a period of 5 years that is an increase of nearly $20,000 a year[23], and this comes amongst consumer pessimism as the economies around the world struggle to stay afloat.
 Conclusion
The purpose of the paper was to try and determine what correlation exists, if any, between the business cycle of an economy and the housing market. What has resulted is the determination that there is a correlation between the two; however that relationship is not equal between the parties involved. Both entities follow a similar growth pattern. While each experiences highs and lows, when examined on a long term scale they both exhibit positive growth.
However, while housing markets do affect the business cycle and GDP level of an economy, the business cycle relies more on the composition of the GDP and all goods and services encompassed in it than one industry. This means that the GDP is much easier to stabilize than housing prices.
Housing markets on the other hand are influenced greatly by the business cycle. It was noted in an earlier section of this paper that while stock markets crashed in 2001 the housing market surged. It was also noted that when significant losses are felt by an economy, housing prices can tumble. What these discoveries point to is a notion of consumer confidence. As with any market, consumers play a major role. With no confidence on behalf of the investor, financial markets struggle. The same is said with housing markets, as consumers ultimately create demand and demand in turn fuels price fluctuations.
To say the business cycles rely on housing is an overstatement. On the other side of that coin however, to say that housing relies heavily on the business cycle is also not entirely accurate. While they both exhibit long term growth, as has been the case for years, and while both often rise and fall together in the long run, their relationship is motivated by a significant number of outside factors.
Business cycles encompass the entire economy as a part of its existence. Housing prices are more heavily influenced by demand than by the GDP. However, there is no denying that there is a definite relationship between the two.
Argentino, Mark. "TREB | Toronto Real Estate Board | Average Single Family Residential Home price graph 2009, historic real estate prices trends in Toronto, Mississauga single family homes properties." Mississauga Real Estate MLS Property Listings|Homes For Sale| Condo Mortgage Rates. 25 Aug. 2009 http://www.mississauga4sale.com/TREBprice.htm
Atkinson, Tom. Housing and Mobility in Metropolitan Toronto. York University Institute of Behavioural Research, 1981.
Biernacki, C.W. Temporal Perspectives on the Toronto Housing Market: Descriptive Indices and Time Date Series. Toronto Real Estate Board, 1977.
Brown, Philip W. Some Perspectives on the Toronto Housing Market. Toronto Real Estate Board, 1977.
"Business Cycle Expansions and Contractions." National Bureau of Economic Research. 15 Apr. 2009 <http://wwwdev.nber.org/cycles/cyclesmain.html>.
Goodhart, Charles, and Boris Hofmann. House Prices and the Macroeconomy Implications for Banking and Price Stability. New York: Oxford UP, USA, 2007.
House Price Trends and Residential Construction Costs in Metropolitan Toronto and Canada. Toronto Real Estate Board, 1972.
Moffat, Mike. "Recession? Depression? What's the difference between a recession and a depression?" Economics at About.Com -- Your Portal to the World of Economics. 15 Apr. 2009 <http://economics.about.com/cs/businesscycles/a/depressions.htm>.
Patterson, Donald G. Canada: An Economic History. 1980.
Popplewell, Brett. "Is history repeating itself?" The Toronto Star [Toronto] 02 May 2009.
"Market Trends and Price Changes." 12 Jan. 2008
Appendix A
Graph 1
Source: Myles Bickram
Appendix B
Graph 1
Source: Housing Prices and Trends
Graph 2
Source: Housing Prices and Trends
Graph 3
Source: The Toronto Real Estate Board
Graph 4
![]()
Source: Statistics Canada
Graph 5

Source: Mark Argentino, P.Eng., Broker
![]()
Mississauga MLS Real Estate Properties & MLS.CA Homes for Sale | All Pages including Mississauga Real Estate Blog all maintained by info@mississauga4sale.com Copyright © A. Mark Argentino, P.Eng., Broker, RE/MAX Realty Specialists Inc., Brokerage, Mississauga, Ontario, Canada L5M 7A1 (905) 828-3434 First created - Tuesday, July 16th, 1996 at 3:48:41 PM - Last Update of this website: Tuesday, April 9, 2024 7:24 AM
At this Mississauga, (Erin Mills, Churchill Meadows, Sawmill Valley, Credit Mills and or Meadowvale ) Ontario, Canada Real Estate Homes and Property Internet web site you will find relevant information to help you and your family.
Why Subscribe? You will receive valuable Real Estate information on a monthly basis - such as: where to find the 'best' mortgage interest rates, Power of Sale Properties and graphs of current house price trends. Plus, you will pick up ideas, suggestions and excellent real estate advice when you sell or buy your next home.
Read Past Newsletters before you decide |